Published: 21 December 2020
Number of personnel continued growing in service industries in 2019
Finland had 400,350 establishments where 1.5 million staff-years were worked in 2019. The number of personnel increased by 30,000 from the previous year. Over 70 per cent of the increase in staff-years was generated by establishments in service industries. These data derive from Statistics Finland's regional statistics on entrepreneurial activity.
Increase in number of personnel in service industries in 2018 to 2019
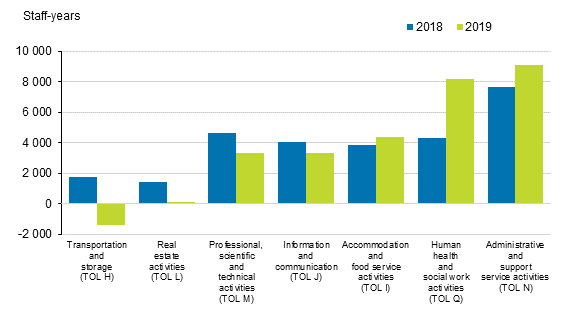
Of the 1.5 million staff-years of all establishments operating in Finland, close on 850,000 worked in the largest towns 1) . There were 189,000 establishments in this area, of which 60 per cent were establishments of service industries. Of the growth in the number of personnel in service industries, 80 per cent took place in establishments in the largest towns.
There were 369,900 enterprises operating in Finland in 2019. The enterprises had a total of 400,350 establishments. The number of enterprises grew by 2.5 per cent and that of establishments by 1.4 per cent from the previous year's level. A majority of the enterprises, or 360,000, had only one establishment. The remaining enterprises, some 7,000, were multi-establishment enterprises with an average of six establishments per enterprise.
Construction enterprices helped maintain turnover growth in 2019
The combined turnover of all establishments was EUR 442.8 billion in 2019. Although the growth in turnover slowed down from the year before, turnover generated in all industries amounted to EUR 6.7 billion, or 1.5 per cent more than in 2018. Turnover grew in the industries of manufacturing, construction and services. Examined by region, the combined turnover of the industries grew most in Kainuu, North Ostrobothnia and North Savo.
Turnover growth percentages by establishments in main industries in 2017 to 2019
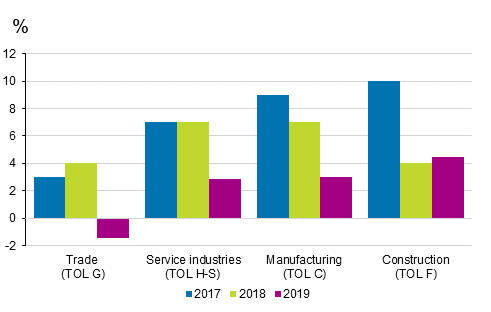
The prolonged turnover growth in construction continued faster than in other industries last year. In the construction industry turnover amounted to EUR 39 billion, which was 4.5 per cent more than in 2018. Turnover in construction developed most favourably in Ostrobothnia, Åland and Uusimaa.
Gross value of establishments’ output grew boosted by service industries
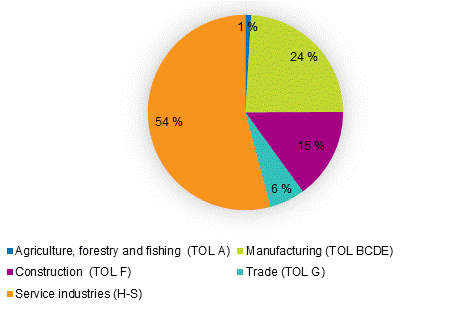
The combined gross value of output in establishment was EUR 332 billion in 2019. The value of output totalled 7.7 billion, which is 2.4 per cent better than one year previously. Output grew in all main industries but growth was driven by establishments in various service industries.
The output of service industry establishments grew by EUR 4.2 billion from the year before. Among the service industries, the value of output grew most in transportation and storage. In the industry the value of output grew by EUR 1.5 billion, which is six per cent more than in 2018.
Distributions (%) of growth in the gross value of output in establishments in 2019
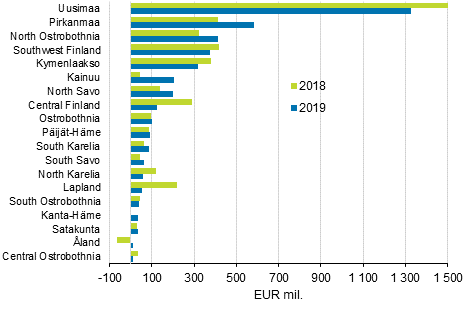
In service industries, development was most favourable in the regions of Uusimaa and Pirkanmaa. In the region of Uusimaa, the value of output grew by EUR 1.3 billion in service industries, most in transportation and storage, and in administrative and support service activities. In Pirkanmaa, the value of output grew by EUR 0.6 billion, one-half of which was generated in transportation and storage, and real estate activities.
Growth in gross value of output in regions in 2019
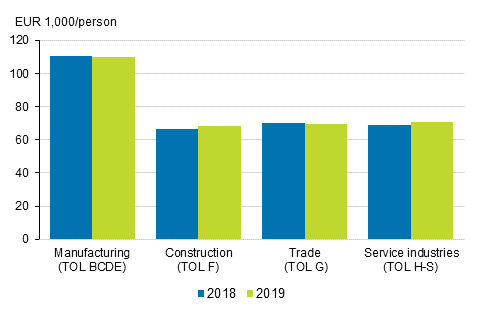
After excluding production costs from the gross value of output, the value added of establishments totalled EUR 118 billion. Value added grew moderately by EUR three billion from 2018, i.e. by three per cent. The value added measures the total value added produced by the various factors of production in an establishment’s actual operating activities. Growth in value added calculated per person usually indicates better profitability and efficiency in operations. The value added by industry per staff year shows that the efficiency of construction and service industries was better than in the year before.
Value added by person in 2018 to 2019
Separate tables on general government establishments are also published in connection with the statistics. The tables contain information on general government establishments operating in our country by industry, general government type and area.
1) Uusimaa, Southwest Finland and Pirkanmaa
Source: Regional statistics on entrepreneurial activity 2019, Statistics Finland
Inquiries: Mira Kuussaari 029 551 3538, Milka Suomalainen 029 551 3621, rakenne.tilastot@stat.fi
Head of Department in charge: Mari Ylä-Jarkko
Publication in pdf-format (247.4 kB)
- Tables
-
Tables in databases
Pick the data you need into tables, view the data as graphs, or download the data for your use.
Appendix tables
Updated 21.12.2020
Official Statistics of Finland (OSF):
Regional statistics on entrepreneurial activity [e-publication].
ISSN=2342-6268. 2019. Helsinki: Statistics Finland [referred: 19.4.2025].
Access method: http://stat.fi/til/alyr/2019/alyr_2019_2020-12-21_tie_001_en.html

