Published: 20 May 2021
Over half a million persons aged 30 to 64 are living alone
Corrected 10 August 2021. Appendix table 3 was corrected. The corrections are indicated in red.
According to Statistics Finland, the number of persons living alone increased further, 33,000 more were living alone in 2020 than in the year before. There are already over half a million working-age persons aged 30 to 64 living alone and they are the largest age group living alone. Over the past five years, the number of persons living alone has increased every year in nearly all age groups. Living alone has grown more common especially among those aged under 30.
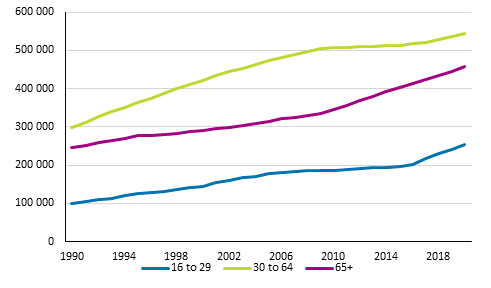
Persons living alone by age group in 1990 to 2020, number

In 2020, the number of persons of working age aged 30 to 64 living alone was around 545,000, the number having grown by 245,000 since 1990. The number of persons aged 30 to 64 living alone grew steadily from 1990 until the 2010s, when the growth stabilised for a few years. In recent years, the number of people aged 30 to 64 living alone has turned upwards again, which is partly explained by the size of the age cohort born in the 1980s. The share of persons living alone among the 30 to 64 age group has grown fairly steadily and in 2020 they numbered more than one in five.
The number of persons aged under 30 living alone has more than doubled since 1990 from 100,000 to 253,000. The share of persons living alone among the dwelling population aged under 30 has grown most in relative terms in recent years. The growth is partly explained by the student financial aid and housing allowance reform in 2017.
The number of persons aged 65 or over living alone has grown over the same period by 210,000 persons, their number being 457,000 in 2020. Although the number of aged persons living alone is growing, the share of people living alone among the dwelling population aged 65 or over has been falling slightly for good ten years. This is particularly explained by the lengthened life expectancy of men, which means that people become widowed later and later.
The growth in living alone has strengthened in recent years, for at the turn of the 2010s (in 2008 to 2012), the number of persons living alone grew by an average of 14,000 persons per year, while over the past five years it has increased by an average of 28,000 persons per year. In 2020, the total number of persons living alone was 1.25 million and the average size of household-dwelling units was 1.96. At the end of 2020, there were nearly 2.77 million household-dwelling units, the number increased by 32,000 from the previous year.
Number of persons living alone has increased in nearly all age groups
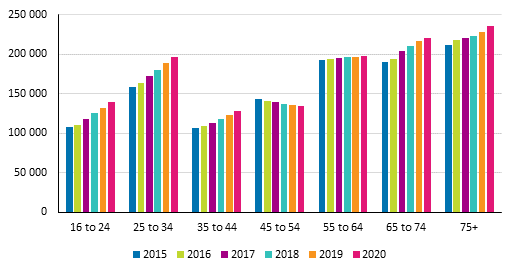
The number of persons living alone has grown every year from 2015 in nearly all age groups. The number of persons living alone has grown most in the 25 to 34 age group, with an increase of almost 38,000 persons in five years.
Persons living alone by age group in 2015 to 2020, number.

As an exception to other age groups, the number of persons living alone among those aged 45 to 54 has decreased every year during the review period. The number of persons living alone in this age group was around six per cent fewer in 2020 than in 2015.
The biggest age groups living alone are those aged 75 and older, and those aged 65 to 74. The increase in the number of elderly people living alone is also partly explained by the ageing of the large age cohort. There are twice as many women as men living alone among those aged 65 or over, while among younger people it is more common for men to live alone.
Source: Dwellings and Housing Conditions, Statistics Finland
Inquiries: Mika Ronkainen 029 551 3425, Anu Rämö 029 551 3450, info@stat.fi
Head of Department in charge: Hannele Orjala
Publication in pdf-format (241.4 kB)
- Tables
-
Tables in databases
Pick the data you need into tables, view the data as graphs, or download the data for your use.
Appendix tables
- Appendix table 1. Household-dwelling units by number of person 1960-2020 (20.5.2021)
- Appendix table 2. Population Householdwelling Units and living alone by sex and age in 2020 (20.5.2021)
- Appendix table 3. Floorarea per dwelling by type of building 1970-2020, whole dwellingstock (Correction on 10 August 2021) (20.5.2021)
Updated 20.5.2021
Official Statistics of Finland (OSF):
Dwellings and housing conditions [e-publication].
ISSN=1798-6761. 2020. Helsinki: Statistics Finland [referred: 26.4.2025].
Access method: http://stat.fi/til/asas/2020/asas_2020_2021-05-20_tie_001_en.html

