Published: 14 December 2015
Total energy consumption fell in 2014
Corrected on 26 January 2016 . Appendix figure 1.
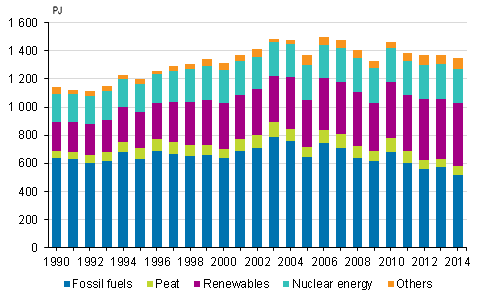
According to Statistics Finland, total consumption of energy in Finland amounted to 1.35 million terajoules (TJ) in 2014, which was two per cent less than in 2013. The consumption of electricity totalled 83.4 terawatt hours (TWh), which was one per cent less than in the previous year. The use of renewable energy sources increased by four per cent and that of fossil fuels decreased by nine per cent. Wood fuels were still the largest source of energy.
Total energy consumption 1990–2014

The share of renewable energy of total energy consumption increased in 2014 and stood at 33 per cent. The share of wood fuels in Finland's total energy consumption continued to grow and was 25 per cent. EU targets for renewable energy are calculated relative to total final energy consumption; calculated in this manner, the share of renewable energy was 39 per cent in Finland in 2014 based on preliminary data. Finland's target for the share of renewable energy is 38 per cent of final energy consumption in 2020.
The use of fossil fuels went down by nine per cent from the year before. Of fossil fuels, the use of natural gas fell by 11 per cent and the use of peat increased by five per cent from 2013. The consumption of coal (including hard coal, coke, and blast furnace and coke oven gas) contracted by 17 per cent. According to Statistics Finland's preliminary data, the consumption of hard coal will continue decreasing in 2015.
Total energy consumption 2013–2014, terajoule
| 2013 | 2014 | Change % | |
| Wood fuels | 338 473 | 339 290 | 0 |
| Oil | 317 726 | 310 032 | -2 |
| Nuclear energy | 247 347 | 247 047 | 0 |
| Coal | 151 312 | 126 170 | -17 |
| Natural gas | 106 925 | 95 373 | -11 |
| Peat | 56 193 | 59 265 | 5 |
| Net imports of electricity | 56 574 | 64 678 | 14 |
| Hydro power | 45 621 | 47 665 | 4 |
| Wind power | 2 785 | 3 986 | 43 |
| Others | 50 007 | 52 911 | 6 |
| Total | 1 372 962 | 1 346 418 | -2 |
The availability of hydro power improved in the Nordic countries in 2014. The production of hydro power increased by 4.5 per cent in Finland. The production of wind power increased by 43 per cent, and it accounted for 1.7 per cent of all electricity produced. Production of nuclear power remained at the same level. In all, 34.6 per cent of Finland's electricity production was covered by nuclear energy.
Imports of electricity increased by 23 per cent. The largest amount of electricity was imported from Sweden, from where imports amounted to 18.2 TWh. Finland was a net buyer on the Nordic electricity market. Imports from Russia decreased by 28 per cent from 2013. Net imports of electricity covered 22 per cent of total electricity consumption.
Electricity consumption went down by one per cent in 2014. Consumption of electricity totalled 83.4 TWh. Consumption of district heating also decreased from 2013. Consumption of district heat totalled 33.3 TWh.
Final consumption of energy decreased by four per cent in manufacturing and by 2.6 per cent in transport. Energy consumption in households was on level with the previous year.
Source: Energy supply and consumption, Statistics Finland
Inquiries: Bate Ismail 029 551 2471, energia@stat.fi
Director in charge: Ville Vertanen
Publication in pdf-format (284.8 kB)
- Tables
-
Tables in databases
Pick the data you need into tables, view the data as graphs, or download the data for your use.
- Figures
-
- Appendix figure 1. Total energy consumption 2014 (14.12.2015)
- Appendix figure 2. Total energy consumption 1970 - 2014 (14.12.2015)
- Appendix figure 3. Energy and electricity intensity 1970 - 2014 (14.12.2015)
- Appendix figure 4. Renewable energy sources 1970 - 2014 (14.12.2015)
- Appendix figure 5. Electricity supply 1970 - 2014 (14.12.2015)
- Appendix figure 6. Electricity consumption by sector 1970 - 2014 (14.12.2015)
Updated 14.12.2015
Official Statistics of Finland (OSF):
Energy supply and consumption [e-publication].
ISSN=1799-7976. 2014. Helsinki: Statistics Finland [referred: 19.4.2025].
Access method: http://stat.fi/til/ehk/2014/ehk_2014_2015-12-14_tie_001_en.html

