Published: 30 September 2020
Energy consumption in transport decreased during the corona spring
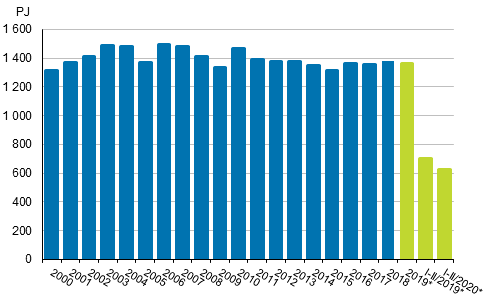
According to Statistics Finland's preliminary data, total energy consumption in January to June amounted to 628 petajoule (PJ), which was ten per cent less than in the corresponding period last year. Electricity consumption amounted to 41.6 terawatt hours (TWh), or seven per cent less than one year earlier. Carbon dioxide emissions from the energy use of fuels declined by 15 per cent year-on-year.
Total energy consumption

*preliminary
The effect of the coronavirus epidemic was visible in the consumption of oil and particularly of liquid transport fuels in the second quarter. The consumption of motor gasoline and diesel diminished by 35 and 25 per cent compared to one year ago. The consumption of jet fuel used in international air transport decreased by 90 per cent. In January to June, the consumption of oil was in total 13 per cent less than one year earlier.
Of other fossil fuels, the consumption of hard coal decreased by 26 per cent and the consumption of natural gas by 13 per cent in the first half of the year. The accelerating decrease in the consumption of coal has been affected by the ban on the use of coal for energy, which will enter into force in 2029. The consumption of peat was 22 per cent lower than one year ago.
In January to June, total electricity consumption fell by per cent from the previous year. In addition to the warm weather, the fall in electricity consumption was affected by lower consumption of electricity in manufacturing. The significant growth in the generation of renewable electricity dependent on weather conditions in the early part of the year evened out in the second quarter. In January to June, production of hydro power and wind power increased by 24 per cent from the year before. As a result of the grown production of domestic hydro and wind power, less electricity was imported than in the year before. Net imports of electricity declined by 26 per cent from the previous year.
In January to June, diverse energy products were imported into Finland to the value of EUR 3.4 billion, which was 36 per cent less than one year earlier. Most energy products were imported from Russia, whose share of the value of imports was 55 per cent. Exports of energy products from Finland amounted to EUR 3.8 billion. The value of exports decreased by 22 per cent from the corresponding quarter of the year before. Most energy products were exported to OECD countries, which accounted for 75 per cent of the value of exports.
Total energy consumption by source (TJ) and CO2 emissions (Mt)
| Energy source | I-II/2020* | Annual change-%* | Percentage share of total energy consumption* |
| Oil 1) | 131,149 | -13 | 21 |
| Coal 2) | 39,599 | -26 | 6 |
| Natural gas 3) | 35,500 | -13 | 6 |
| Nuclear energy 4) | 124,373 | 1 | 20 |
| Net imports of electricity 5) | 25,691 | -26 | 4 |
| Hydro power 5) | 29,784 | 24 | 5 |
| Wind power 5) | 14,268 | 24 | 2 |
| Peat | 25,834 | -22 | 4 |
| Wood fuels | 166,187 | -14 | 27 |
| Others 6) | 34,882 | -5 | 6 |
| TOTAL ENERGY CONSUMPTION | 627,537 | -10 | 100 |
| Bunkers | 13,842 | -43 | . |
| CO2 emissions from energy sector | 17 | -15 | . |
. = Category not applicable
1) Oil: includes the bio part of transport fuels.
2) Coal: includes hard coal, coke, blast furnace gas and coke oven gas.
3) The consumption of natural gas does not include raw material use.
4) Conversion of electricity generation into fuel units: Nuclear power: 10.91 TJ/GWh (33% total efficiency)
5) Conversion of electricity generation into fuel units: Hydro power, wind power and net imports of electricity: 3.6 TJ/GWh (100%)
6) Others: includes exothermic heat from industry, recovered fuels, heat pumps, hydrogen, biogas, other bioenergy and solar energy.
Source: Statistics Finland, Energy supply and consumption
Inquiries: Aleksi Sandberg 029 551 3326, Mari Ylä-Jarkko , energia@stat.fi
Publication in pdf-format (261.6 kB)
- Tables
-
Tables in databases
Pick the data you need into tables, view the data as graphs, or download the data for your use.
- Figures
-
- Appendix figure 1. Changes in GDP, Final energy consumption and electricity consumption (30.9.2020)
- Appendix figure 2. Carbon dioxide emissions from fossil fuels and peat use (30.9.2020)
- Appendix figure 3. Coal consumption (30.9.2020)
- Appendix figure 4. Natural gas consumption (30.9.2020)
- Appendix figure 5. Energy peat consumption (30.9.2020)
- Appendix figure 6. Domestic oil deliveries (30.9.2020)
- Revisions in these statistics
-
- Revisions in these statistics (30.9.2020)
Updated 30.9.2020
Official Statistics of Finland (OSF):
Energy supply and consumption [e-publication].
ISSN=1799-7976. 2nd quarter 2020. Helsinki: Statistics Finland [referred: 10.3.2025].
Access method: http://stat.fi/til/ehk/2020/02/ehk_2020_02_2020-09-30_tie_001_en.html

