This set of statistics has been discontinued.
Statistical data on this topic are published in connection with another set of statistics.
Data published after 5 April 2022 can be found on the renewed website.
Published: 16 March 2006
Total energy consumption fell clearly in 2005
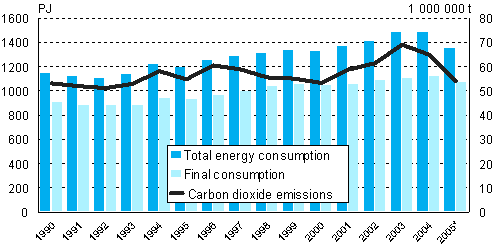
According to Statistics Finland's preliminary data, total energy consumption amounted to 1,360 petajoule in 2005, which was almost 9 per cent less than in the previous year. Consumption of electricity totalled 85 TWh, i.e. over 2 per cent less than in 2004. Carbon dioxide emissions from production and use of energy declined by 17 per cent compared with emissions one year before. Total consumption of energy and emissions decreased, because condensate production of electricity fell to one third from the previous year's high level and net imports of electricity rose record high. The decrease in consumption of electricity was due to reduced energy need of industry.
Fossil fuels were used 15 per cent and peat 26 per cent less than in the year before. Use of coal fell by as much as 41 per cent. Use of renewable energy also declined clearly, by 10 per cent. As a result of the industrial action in the forest industry, use of black liquor fell by 16 per cent.
Carbon dioxide emissions from production and use of energy fell due to the decrease in consumption of fossil fuels and peat. Emissions amounted to around 54 million tonnes, while in the year before they were over 65 million tonnes. The fall was 17 per cent.
Production of electricity contracted substantially, by as much as 17 per cent. In addition to condensate production, the volumes of combined electricity production and hydro power fell clearly. Last year more electricity was imported to Finland than ever before, nearly 18 TWh. Net imports rose to 17 TWh, because exports to the Nordic Countries were turned into large imports due to the improved water situation there.
Total energy consumption

* year 2005 data preliminary
Energy consumption 2004 - 2005, terajoule
| 2005* TJ |
2004 TJ |
Change % |
|
| Oil | 362 505 | 373 819 | -3% |
| Wood fuels | 270 980 | 306 026 | -11% |
| Nuclear energy | 243 644 | 237 971 | 2% |
| Natural gas | 148 860 | 163 008 | -9% |
| Coal | 129 693 | 220 366 | -41% |
| Peat | 66 000 | 88 790 | -26% |
| Net imports of electricity | 61 160 | 17 532 | 249% |
| Hydro power | 49 550 | 53 946 | -8% |
| Others | 25 787 | 24 598 | 5% |
| Total | 1 358 180 | 1 486 053 | -9% |
Source: Preliminary energy statistics 2005. Statistics Finland.
Inquiries: Mr Saku Slioor +358 9 1734 2685, energia.tilastokeskus@stat.fi
Director in charge: Ms Kaija Hovi
Links: Greenhouse gas Inventory in Finland .
- Reviews
-
- Total energy consumption fell clearly (16.3.2006)
- Tables
-
Appendix tables
- Electricity Consumption 1990-2005 (preliminary) (Excel) (16.3.2006)
- Final Energy Consumption 1990-2005 (preliminary) (Excel) (16.3.2006)
- Fossil Fuels and Renewables 1990-2005 (preliminary) (Excel) (16.3.2006)
- Production and Consumption of District Heat 1990-2005 (preliminary) (Excel) (16.3.2006)
- Supplies and Total Consumption of Electricity 1990-2005 (preliminary) (Excel) (16.3.2006)
- Table 1: Total Energy Consumption by Energy Source 1990-2005 (preliminary) (Excel) (16.3.2006)
Last updated 23.3.2006
Official Statistics of Finland (OSF):
Energy consumption [e-publication].
ISSN=1798-6869. 2005. Helsinki: Statistics Finland [referred: 19.4.2025].
Access method: http://stat.fi/til/ekul/2005/ekul_2005_2006-03-16_tie_001_en.html

