Published: 12 July 2019
European Parliament elections 2019, overview on voting
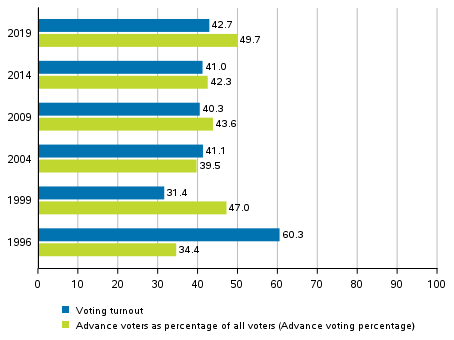
Statistics Finland releases data on the background of persons who voted in the European Parliament elections 2019. The voting percentage of Finnish citizens resident in Finland was 42.7 which is 1.7 percentage points higher than in the previous European Parliament elections. Around one-half of those who voted (49.7%) did so in advance. Detailed information about unit-level background factors on voting turnout is found in the review. Persons who voted in the European Parliament elections 2019.
Voting percentages (Finnish citizens resident in Finland) in the European Parliament elections 1996–2019

An electronic voting register was in use in 143 municipalities, of which 88 municipalities’ data were received from all voting districts. Thus, data on those having voted on the election day were also available from these 143 municipalities. The electronic voting register covered 41.9 per cent of the persons entitled to vote in the European Parliament elections 2019.
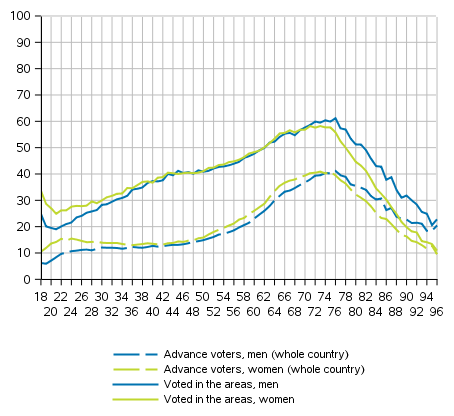
Those aged 75 were the most active advance voters in the whole country (40.5% of persons entitled to vote), the number of advance voters lowest was in relative terms among those aged 18 (8.3%).
In the voting districts where voting data was also available for the election day, the voting turnout was highest for those entitled to vote aged 74, of whom 58.9 per cent voted. Women voted more actively than men in the whole country, the difference between men's and women's voting turnout was 1.7 percentage points.
Women voted more actively in advance in the whole country up to the age of 73. Voting turnout in areas where an electronic voting register was in use was higher for women, especially for young people entitled to vote aged 18 to 38.
Advance voters in the whole country and all who voted in the areas (Finnish citizens resident in Finland) by sex and age in the European Parliament elections 2019, %

Source: European Parliament Elections 2019, Statistics Finland
Inquiries: Sami Fredriksson 029 551 2696, Jaana Asikainen 029 551 3506, vaalit@stat.fi
Director in charge: Jari Tarkoma
Publication in pdf-format (639.3 kB)
- Reviews
- Tables
-
Tables in databases
Pick the data you need into tables, view the data as graphs, or download the data for your use.
Appendix tables
- Quality descriptions
Updated 12.7.2019
Official Statistics of Finland (OSF):
European Parliament elections [e-publication].
ISSN=1798-291X. 2019. Helsinki: Statistics Finland [referred: 19.4.2025].
Access method: http://stat.fi/til/euvaa/2019/euvaa_2019_2019-07-12_tie_001_en.html

