Parliamentary elections 2007 - background information on the candidates and elected MPs
The total number of candidates in the Parliamentary elections is 2,004. Of these, 1,205 are men and 799 women. Of the major parties, the Christian Democrats and the Centre Party have the lowest proportion of women candidates (39.4 % and 43.8 %, respectively). The highest proportions of women candidates are in the Green League (52.5 %) and the Social Democrats (49.1 %). Only the Green League has more women than men candidates. A majority, or 52 per cent, of the persons entitled to vote are women.
Proportion of men and women of persons entitled to vote and candidates by party in Parliamentary elections 2007
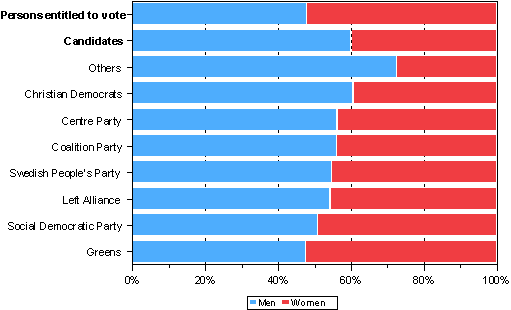
Proportion of men and women of persons entitled to vote and candidates by party in Parliamentary elections 2007
| Men | Women | |
| Persons entitled to vote | 47,9 | 52,1 |
| Candidates | 60,1 | 39,9 |
| Others | 72,6 | 27,4 |
| Christian Democrats | 60,6 | 39,4 |
| Centre Party | 56,2 | 43,8 |
| Coalition Party | 56,0 | 44,0 |
| Swedish People's Party | 54,7 | 45,3 |
| Left Alliance | 54,3 | 45,7 |
| Social Democratic Party | 50,9 | 49,1 |
| Greens | 47,5 | 52,5 |
Women's proportion of persons entitled to vote and candidates by constituency in Parliamentary elections 2007
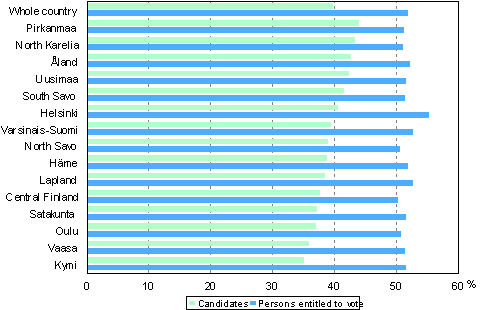
Women's proportion of persons entitled to vote and candidates by constituency in Parliamentary elections 2007
| Constituency | Candidates | Persons entitled to vote |
| Whole country | 39,9 | 52,1 |
| Pirkanmaa | 44,1 | 51,4 |
| North Karelia | 43,5 | 51,3 |
| Åland | 42,9 | 52,4 |
| Uusimaa | 42,6 | 51,8 |
| South Savo | 41,7 | 51,5 |
| Helsinki | 40,8 | 55,5 |
| Varsinais-Suomi | 39,6 | 52,8 |
| North Savo | 39,1 | 50,8 |
| Häme | 39,0 | 52,0 |
| Lapland | 38,6 | 52,9 |
| Central Finland | 37,9 | 50,4 |
| Satakunta | 37,4 | 51,7 |
| Oulu | 37,2 | 50,9 |
| Vaasa | 36,1 | 51,5 |
| Kymi | 35,3 | 51,7 |
The lowest proportions of women candidates are in the constituencies of Kymi (35.3 %) and Vaasa (36.1 %). The highest number of women candidates is in the constituency of Pirkanmaa (44.1 %). In the constituencies of Vaasa, Oulu and Satakunta, the proportion of women candidates ranges between 36 and 37 per cent.
The majority of persons entitled to vote are women in all constituencies. The strongest majority is in the constituency of Helsinki, where 56 % of the persons entitled to vote are women. However, only 41 % of the candidates are women. The weakest women majority, 50 per cent, is in the constituency of Central Finland. The proportions of women of all persons entitled to vote has been influenced by migration in the past years, which has continuously brought slightly more women than men into areas with migration gain. The proportion of men has grown in areas with migration loss. The difference between the population structure and the candidate structure, or the under-representation of women, is greatest in the constituency of Kymi, where 35 % of the candidates, but 52 % of the persons entitled to vote, are women. The smallest difference, 7 percentage points, is in the constituency of Pirkanmaa.
Foreign backround
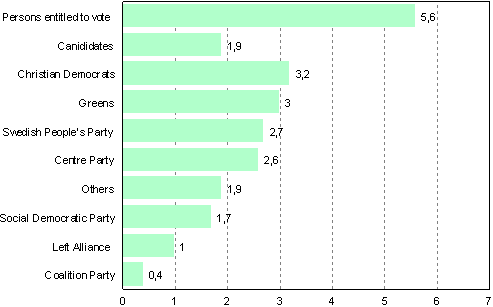
Only 2 per cent of the candidates have a foreign background. Six per cent of the persons entitled to vote have a foreign background. Persons whose mother tongue is not Finnish, Swedish or Sami are regarded as having a foreign background. The Christian Democrats nominated the highest proportion of candidates with a foreign background (3.2 %) and the Coalition Party the lowest (0.4 %).
Persons entitled to vote and candidates with a foreign background in Parliamentary elections 2007
Average age
The average age of both men and women candidates has gone up slightly, 0.2 years for both, from the previous elections. The average age of men candidates is now 48.1 years and that of women candidates 43.8.
Average age of candidates by sex in Parliamentary elections 2007
| Constituency | Men | Women |
| Whole country | 48,1 | 43,8 |
| Oulu | 49,9 | 43,2 |
| Lapland | 49,7 | 48,2 |
| Pirkanmaa | 49,3 | 45,2 |
| North Karelia | 49,0 | 40,3 |
| Åland | 48,8 | 50,7 |
| Kymi | 48,6 | 44,2 |
| Central Finland | 48,3 | 42,4 |
| South Savo | 48,2 | 38,2 |
| North Savo | 48,1 | 41,4 |
| Uusimaa | 47,9 | 43,7 |
| Helsinki | 47,6 | 45,4 |
| Häme | 47,4 | 45,9 |
| Satakunta | 47,2 | 42,0 |
| Varsinais-Suomi | 47,2 | 43,4 |
| Vaasa | 47,1 | 42,2 |
Average age of candidates by sex in Parliamentary elections 2007
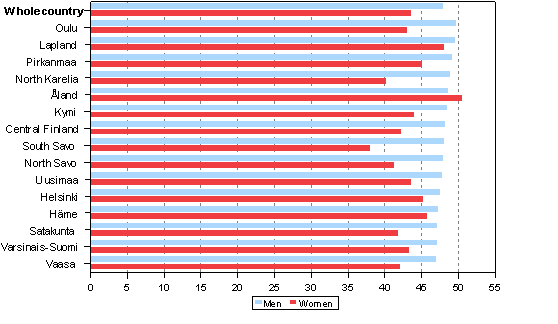
The average age of men entitled to vote is 47.5 years and that of women 50.3 years. Men candidates are roughly the same age as the men entitled to vote, but women candidates are nearly seven years younger than women entitled to vote.
Clearly the youngest women candidates are nominated in South Savo, where the average age is 38.2 years. In the constituency of North Karelia their average age is 40.3 years. The youngest men candidates are nominated in Vaasa (47.1 years) and Varsinais-Suomi (47.2 years). The oldest men candidates are nominated in Oulu (49.9 years) and Lapland (49.7 years). The oldest women candidates are nominated in Åland (50.7 years) and Lapland (48.2 years). The largest age difference between men and women candidates (10 years) is in North Savo and the smallest in Helsinki and Lapland (1.5 years).
Average age of persons entitled to vote and candidates in Parliamentary elections 2007
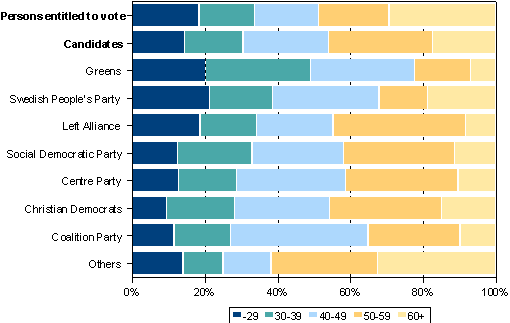
Average age of persons entitled to vote and candidates in Parliamentary elections 2007
| -29 | 30-39 | 40-49 | 50-59 | 60+ | |
| Persons entitled to vote | 18,4 | 15,2 | 17,7 | 19,3 | 29,3 |
| Candidates | 14,4 | 16,1 | 23,6 | 28,5 | 17,4 |
| Greens | 20,3 | 28,7 | 28,7 | 15,3 | 6,9 |
| Swedish People's Party | 21,3 | 17,3 | 29,3 | 13,3 | 18,7 |
| Left Alliance | 18,8 | 15,4 | 21,2 | 36,5 | 8,2 |
| Social Democratic Party | 12,6 | 20,4 | 25,2 | 30,4 | 11,3 |
| Centre Party | 12,9 | 15,9 | 30,0 | 30,9 | 10,3 |
| Christian Democrats | 9,6 | 18,6 | 26,1 | 30,9 | 14,9 |
| Coalition Party | 11,6 | 15,6 | 37,8 | 25,3 | 9,8 |
| Others | 14,0 | 11,0 | 13,2 | 29,2 | 32,5 |
The Green League has the highest proportion, nearly one half, of candidates younger than 40 years of age. The proportion of candidates younger than 40 years of age is higher than their proportion of the persons entitled to vote also in the Swedish People's Party and the Left Alliance. The lowest proportions of young candidates are nominated by the Christian Democrats and the Coalition Party. The Coalition Party has the highest proportion of candidates aged 40 to 49, the Left Alliance, the Centre Party and the Christian Democrats have the highest proportion of candidates aged 50 to 59. Persons over 60 years of age are under-represented in all parties. Only in small parties the proportion of candidates over 60 years of age is slightly higher than their proportion of all voters.
Employment
Persons entitled to vote and candidates by main type of activity in Parliamentary elections 2007
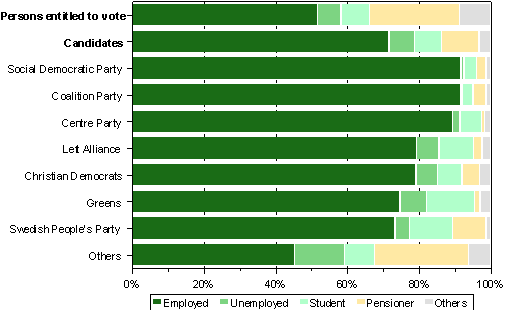
Just over one half, or 51.6 % of all persons entitled to vote are employed, seven per cent are unemployed, eight per cent are students, and 25 per cent pensioners. The proportions of candidates who are employed are the following in the three major parties: the Social Democrats and the Coalition Party 92 per cent and the Centre Party 89 per cent. The Social Democrats, the Coalition Party and the Centre Party have virtually no unemployed candidates. The major parties nominated only 6 to 7 per cent student and pensioner candidates. The proportion of student candidates is highest among the Green League and the Swedish People's Party.
Since the last elections, the proportion of the employed has gone up by a few percentage points and correspondingly the proportions of the unemployed, students and pensioners have gone down from their already low levels. The candidates differ most from the persons entitled to vote in that the proportions of the employed are higher 20 percentage points and pensioners are lower 15 percentage points.
Persons entitled to vote and candidates by main type of activity in Parliamentary elections 2007
| Employed | Unemployed | Student | Pensioner | Others | |
| Persons entitled to vote | 51,6 | 6,6 | 8,0 | 25,0 | 8,7 |
| Candidates | 71,7 | 7,0 | 7,6 | 10,4 | 3,3 |
| Social Democratic Party | 91,7 | 0,9 | 3,5 | 2,6 | 1,3 |
| Coalition Party | 91,6 | 0,4 | 3,1 | 3,6 | 1,3 |
| Centre Party | 89,3 | 2,1 | 6,0 | 0,9 | 1,7 |
| Left Alliance | 79,3 | 6,3 | 9,6 | 2,4 | 2,4 |
| Christian Democrats | 79,3 | 5,9 | 6,9 | 4,8 | 3,2 |
| Greens | 74,8 | 7,4 | 13,4 | 1,5 | 3,0 |
| Swedish People's Party | 73,3 | 4,0 | 12,0 | 9,3 | 1,3 |
| Others | 45,3 | 14,0 | 8,4 | 26,3 | 6,1 |
Family type
Persons entitled to vote and candidates by family type in Parliamentary elections 2007
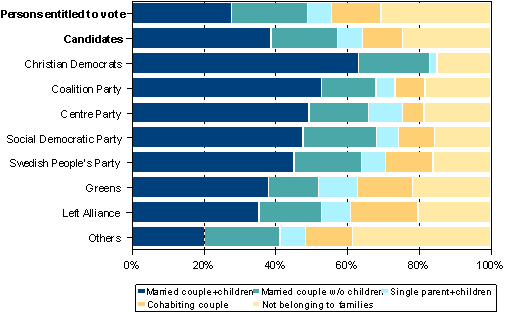
Slightly less than one half (49 %) of all persons entitled to vote are married, 13.8 per cent are cohabiting and 30.5 per cent do not belong to a family. 57.4 per cent of the candidates are married, 11 per cent are cohabiting and 24.6 per cent do not belong to a family. In both groups, 7 per cent are single parents.
Christian Democrat candidates differ most from the voters: 83 per cent are married, and none are cohabiting. The Green League and the Left Alliance have the lowest proportions of married persons (38 % and 36 %, respectively) but the proportion of cohabiting couples is the highest, 15 to 19 per cent.
Of all candidates, one fourth does not belong to a family (they usually live alone). The highest proportion, 22 per cent, is nominated by the Green League. The number of persons not belonging to a family of all persons entitled to vote has gone up by five and their number of candidates by three percentage points. Widowed persons living alone, for example, do not belong to a family and their proportion grows continuously as a consequence of population ageing.
Persons entitled to vote and candidates by family type in Parliamentary elections 2007
| Married couple+children | Married couple w/o children | Single parent+children | Cohabiting couple | Not belonging to families | |
| Persons entitled to vote | 27,9 | 21,1 | 6,8 | 13,8 | 30,5 |
| Candidates | 38,9 | 18,5 | 7,0 | 11,0 | 24,6 |
| Christian Democrats | 63,3 | 19,7 | 2,1 | 0,0 | 14,9 |
| Coalition Party | 52,9 | 15,1 | 5,3 | 8,4 | 18,2 |
| Centre Party | 49,4 | 16,7 | 9,4 | 6,0 | 18,5 |
| Social Democratic Party | 47,8 | 20,4 | 6,1 | 10,0 | 15,7 |
| Swedish People's Party | 45,3 | 18,7 | 6,7 | 13,3 | 16,0 |
| Greens | 38,1 | 13,9 | 10,9 | 15,3 | 21,8 |
| Left Alliance | 35,6 | 17,3 | 8,2 | 18,8 | 20,2 |
| Others | 20,4 | 21,0 | 7,0 | 13,2 | 38,4 |
The majority of the major party candidates are married: 66 per cent of Centre Party candidates, 68 per cent of Coalition Party candidates and of Social Democrats candidates. The Social Democrats have the greatest proportion of cohabiting candidates (10 %). The proportion of families consisting of married spouses and children has declined in all parties, whereas the proportion of cohabitation households has increased, as has the proportion of persons living alone.
Candidates by number of children in 2007
More than one half of the major party candidates live with their legal or cohabiting spouse as well as their children. 38 per cent of the persons entitled to vote - but only 28 per cent of the candidates - do not have children of their own. The practicalities of family life with children are more often familiar to candidates than to the population on average. The proportion of candidates who do not have children of their own is on average greater in parties such as the Green League, which have a large proportion of young candidates. The Social Democrats have the lowest proportion of candidates without children (only 21 per cent).
Persons entitled to vote and candidates by number of biological children in Parliamentary elections 2007
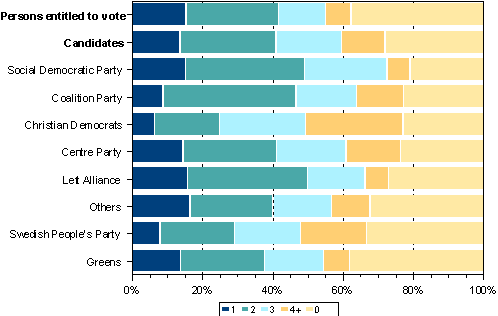
Persons entitled to vote and candidates by number of biological children in Parliamentary elections 2007
| 1 | 2 | 3 | 4+ | 0 | |
| Persons entitled to vote | 15,4 | 26,3 | 13,4 | 7,3 | 37,7 |
| Candidates | 13,7 | 27,3 | 18,7 | 12,3 | 28,0 |
| Social Democratic Party | 15,2 | 33,9 | 23,5 | 6,5 | 20,9 |
| Coalition Party | 8,9 | 37,8 | 17,3 | 13,3 | 22,7 |
| Christian Democrats | 6,4 | 18,6 | 24,5 | 27,7 | 22,9 |
| Centre Party | 14,6 | 26,6 | 19,7 | 15,5 | 23,6 |
| Left Alliance | 15,9 | 34,1 | 16,3 | 6,7 | 26,9 |
| Others | 16,5 | 23,6 | 16,6 | 11,0 | 32,2 |
| Swedish People's Party | 8,0 | 21,3 | 18,7 | 18,7 | 33,3 |
| Greens | 13,9 | 23,8 | 16,8 | 7,4 | 38,1 |
Persons entitled to vote and candidates by educational level in 2007
Highly educated people are seeking entry to the Parliament. The educational level of the candidates of almost all parties is higher than that of the average population. Of the total population, 38 per cent rely on basic level education, but this is the case only for 15 per cent of the candidates. Of the candidates nominated by the major parties even fewer rely on basic level education: 5 % for the Green League, 8 % for the Christian Democrats, 11 % for the Social Democrats and 12 % for the Centre Party. More than one half of the candidates are educated to the tertiary level, but only one fourth of those entitled to vote have attained that level. One third of the candidates nominated by the Social Democrats have a basic or secondary level education. Of the candidates nominated by the Green League, 73 % are educated to the tertiary level.
Persons entitled to vote and candidates by educational level in Parliamentary elections 2007
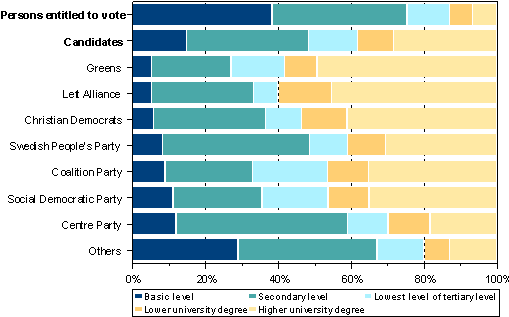
Persons entitled to vote and candidates by educational level in Parliamentary elections 2007
| Basic level | Secondary level | Lowest level of tertiary level | Lower university degree | Higher university degree | |
| Persons entitled to vote | 38,4 | 37,1 | 11,6 | 6,3 | 6,7 |
| Candidates | 15,0 | 33,4 | 13,5 | 9,8 | 28,3 |
| Greens | 5,3 | 21,8 | 14,7 | 8,9 | 49,3 |
| Left Alliance | 5,3 | 28,0 | 6,7 | 14,7 | 45,3 |
| Christian Democrats | 5,9 | 30,7 | 9,9 | 12,4 | 41,1 |
| Swedish People's Party | 8,3 | 40,4 | 10,4 | 10,4 | 30,4 |
| Coalition Party | 9,0 | 24,0 | 20,6 | 11,2 | 35,2 |
| Social Democratic Party | 11,2 | 24,5 | 18,1 | 11,2 | 35,1 |
| Centre Party | 12,0 | 47,1 | 11,1 | 11,5 | 18,3 |
| Others | 29,1 | 38,1 | 12,9 | 7,0 | 12,9 |
Persons entitled to vote and candidates by taxable income in Parliamentary elections 2007
Income is the one variable that marks the greatest difference between candidates and voters. The 2003 taxable income of the candidates averaged EUR 34,200 - 74 per cent higher than the average income of the voters. The 2007 income of the candidates was EUR 38,000 - 80 per cent higher than the income of the voters.
The average income of a voter was EUR 21,000. The EUR 70,000 average income of Coalition Party candidates was three times that of the voters. A Swedish People's Party candidate's average income was EUR 65,000, Centre Party candidates earned on average EUR 52,000 and Social Democrat candidates EUR 47,000. Green League candidates had the lowest average income, EUR 29,000.
Persons entitled to vote and candidates by average income (in euro) in Parliamentary elections in 2007, 2003, 1999 and 1995
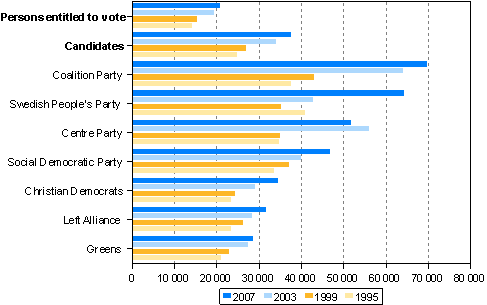
Persons entitled to vote and candidates by average income (in euro) in Parliamentary elections in 2007, 2003, 1999 and 1995
| 2007 | 2003 | 1999 | 1995 | Change% 1995-2007 |
Change% 2003-2007 |
|
| Persons entitled to vote | 21 037 | 19 675 | 15 638 | 14 397 | 46,1 | 106,9 |
| Candidates | 37 749 | 34 197 | 27 186 | 25 066 | 50,6 | 110,4 |
| Coalition Party | 69 987 | 64 374 | 43 301 | 37 886 | 84,7 | 108,7 |
| Swedish People's Party | 64 558 | 43 148 | 35 538 | 41 110 | 57,0 | 149,6 |
| Centre Party | 52 128 | 56 259 | 35 295 | 35 028 | 48,8 | 92,7 |
| Social Democratic Party | 47 072 | 40 209 | 37 401 | 33 741 | 39,5 | 117,1 |
| Christian Democrats | 34 755 | 29 410 | 24 677 | 23 613 | 47,2 | 118,2 |
| Left Alliance | 32 024 | 28 514 | 26 530 | 23 621 | 35,6 | 112,3 |
| Greens | 28 946 | 27 788 | 23 184 | 21 322 | 35,8 | 104,2 |
Voters' nominal income has increased by 7 per cent during the present parliamentary period and that of candidates has increased by 10 per cent. The Swedish People's Party candidates have the largest increase in income, 50 per cent. The Christian Democrat candidates' income increased by 18 %, but the income of the Centre Party's present candidates are 7 per cent lower than those of the candidates in the previous elections.
The income level of voters is the highest in the constituencies of Helsinki, Uusimaa and Åland. The candidates with the highest income are from Åland and Uusimaa.
Average income of persons entitled to vote and candidates by constituency in Parliamentary elections 2007
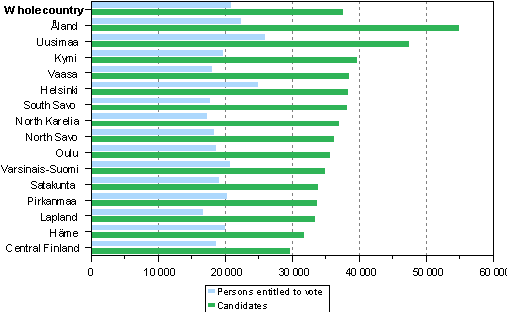
Average income of persons entitled to vote and candidates by constituency in Parliamentary elections 2007
| Constituency | Persons entitled to vote | Candidates | % |
| Whole country | 21 037 | 37 749 | 179,4 |
| Åland | 22 626 | 55 090 | 243,5 |
| Uusimaa | 26 150 | 47 619 | 182,1 |
| Kymi | 19 846 | 39 811 | 200,6 |
| Vaasa | 18 311 | 38 708 | 211,4 |
| Helsinki | 25 138 | 38 540 | 153,3 |
| South Savo | 17 986 | 38 388 | 213,4 |
| North Karelia | 17 481 | 37 115 | 212,3 |
| North Savo | 18 543 | 36 426 | 196,4 |
| Oulu | 18 895 | 35 795 | 189,4 |
| Varsinais-Suomi | 20 864 | 35 091 | 168,2 |
| Satakunta | 19 326 | 33 997 | 175,9 |
| Pirkanmaa | 20 466 | 33 824 | 165,3 |
| Lapland | 16 915 | 33 622 | 198,8 |
| Häme | 20 119 | 31 930 | 158,7 |
| Central Finland | 18 779 | 29 938 | 159,4 |
The candidates' income level reflects the regional variations in voters' income levels, albeit on a higher level. The candidates with the highest income level are nominated in Åland (EUR 55,000) and Uusimaa (EUR 47,600). The average income of candidates from Åland is 2.4 times and that of candidates from Uusimaa is 1.8 times higher than that of the voters in these constituencies. The income level of candidates is also over twice that of the voters in the constituencies of Kymi, Vaasa, South Savo and North Karelia The poorest voters are in Lapland, South Savo and North Karelia, where their average income is less than EUR 18,000. The candidates with the lowest income, EUR 30,000, are nominated in the constituency of Central Finland.
The income of candidates is approximately 80 per cent higher than that of voters in all constituencies.
Income brackets
The majority of Coalition Party and Centre Party candidates have an income of over EUR 42,000. The EUR 42,000 limit is exceeded by 57 % of the Coalition Party candidates, 53 % of the Centre Party candidates, 44 % of the Social Democrat candidates and 43 % of the candidates of the Swedish Peoples' Party. Only 9 per cent of voters earn over EUR 42,000. During the present parliamentary period, the number of persons with an income in excess of EUR 42,000 has increased, particularly among Coalition Party and Centre Party candidates.
The proportion of low-income candidates is highest among the candidates of the Green League, the Left Alliance and the Christian Democrats. The income structure of small parties' candidates resembles the voters' average income structure much more closely than that of the major parties' candidates.
Persons entitled to vote and candidates by taxable income (in euro) in Parliamentary elections 2007
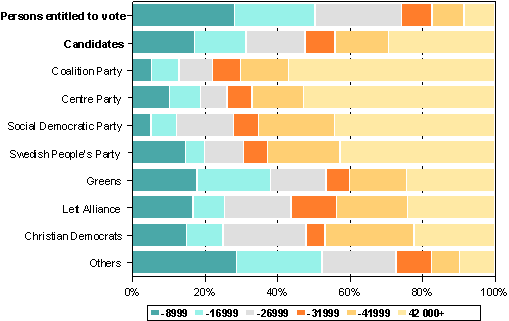
Persons entitled to vote and candidates by taxable income (in euro) in Parliamentary elections 2007
| -8 999 | -16 999 | -26 999 | -31 999 | -41 999 | 42 000+ | |
| Persons entitled to vote | 28,2 | 22,2 | 23,9 | 8,4 | 8,8 | 8,5 |
| Candidates | 17,1 | 14,3 | 16,3 | 8,3 | 14,7 | 29,4 |
| Coalition Party | 5,3 | 7,6 | 9,3 | 7,6 | 13,3 | 56,9 |
| Centre Party | 10,3 | 8,6 | 7,3 | 6,9 | 14,2 | 52,8 |
| Social Democratic Party | 5,2 | 7,0 | 15,7 | 7,0 | 20,9 | 44,3 |
| Swedish People's Party | 14,7 | 5,3 | 10,7 | 6,7 | 20,0 | 42,7 |
| Greens | 17,8 | 20,3 | 15,3 | 6,4 | 15,8 | 24,3 |
| Left Alliance | 16,8 | 8,7 | 18,3 | 12,5 | 19,7 | 24,0 |
| Christian Democrats | 14,9 | 10,1 | 22,9 | 5,3 | 24,5 | 22,3 |
| Others | 28,8 | 23,5 | 20,5 | 9,8 | 7,6 | 9,8 |
Last updated 18.3.2007
Official Statistics of Finland (OSF):
Parliamentary elections [e-publication].
ISSN=1799-6279. 2007,
Parliamentary elections 2007 - background information on the candidates and elected MPs
. Helsinki: Statistics Finland [referred: 20.4.2025].
Access method: http://stat.fi/til/evaa/2007/evaa_2007_2007-03-18_kat_001_en.html

