Published: 22 March 2007
Confirmed result. Coalition Party victorious in elections, Centre Party stayed the biggest party in the Parliamentary elections 2007
Support for the three major parties was on an even level. Their order did, however, change when compared with four years previously.
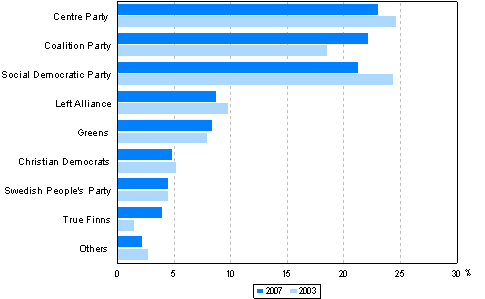
The Coalition Party was the biggest winner in these elections when compared with the previous Parliamentary elections. Its support increased the most of all parties, by 3.7 percentage points, and it received 22.3 per cent of all votes in the country, which made the Coalition Party the second largest party. The number of votes cast for the Coalition Party gave it 10 additional seats in Parliament. In total, the Coalition Party got 50 seats in Parliament and 616,841 votes in the whole country, which is nearly 99,000 votes more than in 2003.
The Centre Party kept its position as the biggest party. It got 23.1 per cent of all the votes cast. When compared with the previous Parliamentary elections, its support went down by 1.6 percentage points. The Centre Party got 640,428 votes and 51 MPs into Parliament. Its number of seats went down by four when compared with the results of 2003. The Centre Party got 23,600 more votes than the Coalition Party.
The Social Democrats suffered a defeat in these elections and fell to the third position among the big parties. The Social democrats got 21.4 per cent of the votes, and lost support by 3.0 percentage points. It lost 8 seats in Parliament. The Social democrats got 594,194 votes, which is nearly 89,000 votes down from the previous elections.
Of other parties the True Finns were most successful in these elections and its number of seats went up from three to five. The Green League and the Swedish People's Party also got one additional seat in Parliament each.
Support for parties in Parliamentary elections 2007 and 2003 (%)

Support for parties in Parliamentary elections 2007 and 2003 (%)
| KESK | KOK | SDP | LEFT | GREENS | KD | RKP | PS | Others | |
| 2007 | 23.1 | 22.3 | 21.4 | 8.8 | 8.5 | 4.9 | 4.6 | 4.1 | 2.3 |
| 2003 | 24.7 | 18.6 | 24.5 | 9.9 | 8.0 | 5.3 | 4.6 | 1.6 | 2.8 |
Participation weaker than in the previous elections
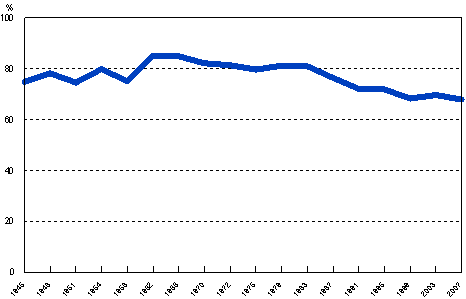
The voting percentage of citizens resident in Finland was 67.9, which is 1.8 percentage points lower than in 2003. Participation in elections has remained weak for a long time. Since 1979 the voting percentages have gone down steadily from election to election, but this time the voting percentage was lower than ever before after the 1945 elections.
Voting turnout was the highest in the constituency of Vaasa, where it was 71.5 per cent. Voting turnout was also higher than the average level in the constituencies of Helsinki (71.1 per cent), Uusimaa (69.9 per cent), Pirkanmaa (68.3 per cent) and Varsinais-Suomi (68.2 per cent).
The total number of persons entitled to vote was 4,292,436. The number of persons entitled to vote resident in Finland was 4,083,549 and the number of persons entitled to vote resident abroad was 208,887. The voting turnout of Finnish citizens resident abroad was traditionally low at 8.6 per cent. Compared to the previous elections it went down by 0.2 percentage points.
Voting turnout1) in Parliamentary elections in 1945 - 2007 (%)

1) As per cent of persons entitled to vote, since 1975 excluding Finnish citizens resident abroad.
Voting turnout1) in Parliamentary elections 1945 - 2007 (%)
| Year | total % |
Year | total % |
Finnish citizens resident abroad |
| 1945 | 74.9 | 1975 | 79.7 | 7.1 |
| 1948 | 78.2 | 1979 | 81.2 | 6.7 |
| 1951 | 74.6 | 1983 | 81.0 | 6.7 |
| 1954 | 79.9 | 1987 | 76.4 | 5.8 |
| 1958 | 75.0 | 1991 | 72.1 | 5.6 |
| 1962 | 85.1 | 1995 | 71.9 | 6.1 |
| 1966 | 84.9 | 1999 | 68.3 | 6.5 |
| 1970 | 82.2 | 2003 | 69.7 | 8.8 |
| 1972 | 81.4 | 2007 | 67.9 | 8.6 |
1) As per cent of persons entitled to vote, since 1975 excluding Finnish citizens resident abroad.
Source: Election Statistics, Parliamentary elections 2007. Statistics Finland
Inquiries: Mr Jari Tarkoma +358 9 1734 3625, vaalit.tilastokeskus@stat.fi
Director in charge: Ms Marja Tammilehto-Luode
- Reviews
- Tables
-
Tables in databases
Pick the data you need into tables, view the data as graphs, or download the data for your use.
Appendix tables
- Quality descriptions
Last updated 22.3.2007
Official Statistics of Finland (OSF):
Parliamentary elections [e-publication].
ISSN=1799-6279. 2007. Helsinki: Statistics Finland [referred: 19.4.2025].
Access method: http://stat.fi/til/evaa/2007/evaa_2007_2007-03-22_tie_002_en.html

