Published: 22 March 2011
Nomination of candidates in Parliamentary elections 2011
Altogether 2,315 candidates were nominated for the elections, which is 311 more than in the previous Parliamentary elections. A total of 17 registered political parties take part in the Parliamentary elections. The number of parties participating in the elections fell by one from the previous Parliamentary elections. Three new parties participate in the elections, while the others took part four years earlier as well. The names of the participating parties and the abbreviations used for them can be found in the quality description of this release.
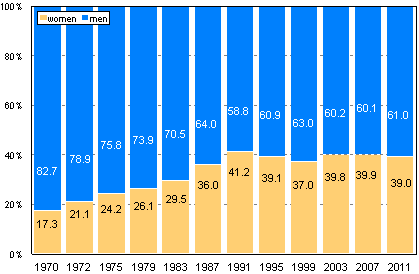
Figure 1. Men and women as percentage of candidates in Parliamentary elections 1970 – 2011, %

Nearly 73 per cent of the candidates were nominated by current parliamentary parties – the Centre Party, National Coalition Party, Social Democratic Party, Left Alliance, Green League, Christian Democrats, Swedish People’s Party and True Finns. The total number of candidates in this group was 1,679. The numbers of candidates nominated by the other parties not in the present Parliament vary considerably. Among them, the highest number of candidates was nominated by the Communist Party of Finland (143) and the lowest by the For the Poor party (12). The number of candidates from outside parties was only 22 in the whole country.
The majority of the Parliamentary election candidates have always been men. In the Parliamentary elections 2011, 1,412 of the candidates are men and 903 women. Women's proportion of candidates in these elections is 39 per cent, which is about one percentage point lower than in the 2007 Parliamentary elections. When comparing with the previous Parliamentary elections, the proportion of women candidates among the candidates for the party decreased in four parliamentary parties. The proportion of women candidates fell most in the Social Democratic Party. In the Social Democratic Party, the proportion of women candidates is 43.3 per cent in these elections, which is nearly six percentage points lower than four years previously. For True Finns, the proportion of women candidates rose most, by over eight percentage points. The proportion of women candidates among parliamentary parties is still smallest for True Finns, 33.2 per cent. The Green League is the only parliamentary party where over one half of the candidates are women. In other parties than those in the Parliament the proportion of women candidates varies more than in the parliamentary parties. In the For the Poor party, three of the party's four candidates are women, while in the Change 2011 and the Pirate Party of Finland only under one sixth of the candidates are women.
Of all candidates, 1,514 were aged 40 or over. Twelve candidates were over the age of 75. In all, 158 candidates were aged under 25, of whom seven were aged 18. The average age of all candidates was 45.4 years, that of male candidates 46.2 and that of female ones 44.3 years. (The age refers to the age of the candidate on the election day).
The national register of candidates is published on the Internet pages of the Ministry of Justice.
Table 1. Number of candidates by sex and party in Parliamentary elections 2011
| Candidates | Tot. | KESK | KOK | SDP | VAS | VIHR | KD | RKP | PS | SKP | SSP | IP | KA | KTP | STP | Pirate Pty |
Change 2011 |
Liberty Pty |
Others |
| Total | 2 315 | 233 | 232 | 238 | 236 | 228 | 191 | 83 | 238 | 143 | 44 | 69 | 12 | 46 | 47 | 127 | 66 | 60 | 22 |
| Men | 1 412 | 137 | 128 | 135 | 133 | 110 | 109 | 46 | 159 | 86 | 26 | 46 | 3 | 35 | 34 | 107 | 56 | 44 | 18 |
| Women | 903 | 96 | 104 | 103 | 103 | 118 | 82 | 37 | 79 | 57 | 18 | 23 | 9 | 11 | 13 | 20 | 10 | 16 | 4 |
Source: Parliamentary Elections 2011, Statistics Finland
Inquiries: Kimmo Moisio (09) 1734 3239, Jaana Asikainen (09) 1734 3506, vaalit@stat.fi
Director in charge: Jari Tarkoma
Publication in pdf-format (403.0 kB)
- Reviews
- Tables
-
Tables in databases
Pick the data you need into tables, view the data as graphs, or download the data for your use.
Appendix tables
- Quality descriptions
-
- Parliamentary elections, quality description (22.3.2011)
Updated 22.3.2011
Official Statistics of Finland (OSF):
Parliamentary elections [e-publication].
ISSN=1799-6279. nomination of candidates 2011. Helsinki: Statistics Finland [referred: 20.4.2025].
Access method: http://stat.fi/til/evaa/2011/01/evaa_2011_01_2011-03-22_tie_001_en.html

