Published: 29 April 2011
True Finns the biggest winner in the elections. Coalition Party the largest party in the Parliamentary elections 2011
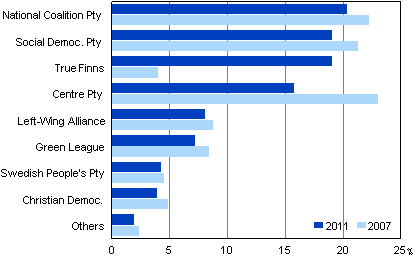
The True Finns emerged as the winner of the elections as the other parliamentary parties lost their support compared with the previous Parliamentary elections. The True Finns increased their support by 15.0 percentage points, thus gaining 19.1 per cent of the country's votes, which raised it from the smallest parliamentary party into the third largest party in Finland. The number of votes cast for the True Finns gave it 34 additional seats in Parliament. In total, the True Finns got 39 MPs and a total of 560,075 votes in the whole country, which is 447,819 votes more than in the Parliamentary elections 2007.
Support for parties in Parliamentary elections 2011 and 2007

The Centre Party of Finland lost most in the elections, as it dropped from the largest party to the fourth biggest party. The Centre Party gained 15.8 per cent of all the votes cast. When compared with the previous Parliamentary elections, its support went down by 7.4 percentage points. The Centre Party received 463,266 votes and 35 MPs into Parliament. The number of seats for the party fell by 16 and the number of votes by 177,162 compared with the 2007 Parliamentary elections.
The National Coalition Party emerged as the largest party. The Coalition Party gained 44 seats and 20.4 per cent of the votes cast. The Coalition Party lost six MPs and gained 1.9 percentage points fewer votes than in the previous Parliamentary elections. In the whole country, the Coalition Party received 599,138 votes, which is 17,703 down from 2007.
The Social Democratic Party became the second largest party in Finland. The Social Democrats gained 19.1 per cent of the votes and 42 seats, which is 2.3 percentage points and three seats down from the Parliamentary elections 2007. The Social Democrats got 561,558 votes, which is 32,636 votes fewer than in the previous Parliamentary elections.
The Left Alliance gained 8.1 per cent of all votes cast and 14 seats. Compared with the previous Parliamentary elections, the number of votes fell by 0.7 percentage points and the number of MPs by three. The Green League gained 7.3 per cent of all votes cast and ten seats. The number of votes cast for the party decreased by 1.2 percentage points and the number of seats went down by five. The Swedish People's Party got 4.3 per cent of the votes casts, which is 0.3 percentage points down from the previous Parliamentary elections. The party retained its nine seats. The Christian Democrats gained 4.0 per cent of the votes or 0.8 percentage points down from the previous Parliamentary elections. The Christian Democrats lost one seat, thus gaining six MPs in Parliament. No new parties entered the Parliament in the 2011 Parliamentary elections.
Support for parties in Parliamentary elections 2011 and 2007
| Party | Parliamentary elections 2011 |
Parliamentary elections 2007 |
| National Coalition Party KOK |
20.4 | 22.3 |
| The Finnish Social Democratic Party SDP |
19.1 | 21.4 |
| True Finns PS |
19.1 | 4.1 |
| Centre Party of Finland KESK |
15.8 | 23.1 |
| Left-Wing Alliance VAS |
8.1 | 8.8 |
| Green League VIHR |
7.3 | 8.5 |
| Swedish People's Party in Finland RKP |
4.3 | 4.6 |
| Christian Democrats KD |
4.0 | 4.9 |
| Others | 2.0 | 2.4 |
Election participation more active than in the previous Parliamentary elections
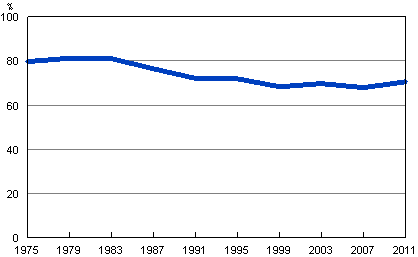
The voting percentage of Finnish citizens resident in Finland was 70.5, which is 2.6 percentage points more than in the 2007 Parliamentary elections. The voting turnout rose in all constituencies, except for the constituency of ┼land. The voting turnout was highest in the constituency of Helsinki, where 75.5 per cent of persons entitled to vote cast their vote. The voting turnout was also higher than average in the constituencies of Vaasa (73.2%), Uusimaa (72.9%), Pirkanmaa (71.5%) and Varsinais-Suomi (71.2%).
The total number of persons entitled to vote was 4,387,701. The number of persons entitled to vote resident in Finland was 4,159,857 and the number of persons entitled to vote resident abroad was 227,844. The voting turnout of Finnish citizens resident abroad was 10.6 per cent, which is 2.0 percentage points higher than in the previous Parliamentary elections.
Voting turnout of Finnish citizens resident in Finland in Parliamentary elections 1975 - 2011, %

Voting turnout in Parliamentary elections 1975 - 2011, % 1)
| Year | Voting turnout of Finnish citizens living in Finland, % |
Voting turnout of Finnish citizens living in abroad, % |
| 1975 | 79.7 | 7.1 |
| 1979 | 81.2 | 6.7 |
| 1983 | 81.0 | 6.7 |
| 1987 | 76.4 | 5.8 |
| 1991 | 72.1 | 5.6 |
| 1995 | 71.9 | 6.1 |
| 1999 | 68.3 | 6.5 |
| 2003 | 69.7 | 8.8 |
| 2007 | 67.8 | 8.5 |
| 2011 | 70.5 | 10.6 |
Source: Parliamentary Elections 2011, confirmed result. Statistics Finland
Inquiries: Kimmo Moisio (09) 1734 3239, Jaana Asikainen (09) 1734 3506, vaalit@stat.fi
Director in charge: Jari Tarkoma
Publication in pdf-format (548.4 kB)
- Reviews
- Tables
-
Tables in databases
Pick the data you need into tables, view the data as graphs, or download the data for your use.
- Quality descriptions
-
- Parliamentary elections, quality description (29.4.2011)
Updated 29.4.2011
Official Statistics of Finland (OSF):
Parliamentary elections [e-publication].
ISSN=1799-6279. 2011. Helsinki: Statistics Finland [referred: 9.3.2025].
Access method: http://stat.fi/til/evaa/2011/evaa_2011_2011-04-29_tie_001_en.html

