2. Background analysis of advance voters in the Parliamentary elections 2015
This review examines persons entitled to vote and advance voters in the Parliamentary elections 2015 according to various background factors. Advance voters are compared with persons entitled to vote, as well as with advance voters in the Parliamentary elections 2011. The data on persons entitled to vote and advance voters derive from the voting register of the Election Information System of the Ministry of Justice. The unit-level background data are based on Statistics Finland’s statistical data, such as population, employment and family statistics and the Register of Completed Education and Degrees. The group under examination is limited to Finnish citizens living Finland, who, in the review, are referred to as persons entitled to vote.
This review examines advance voters, which should be taken into account when interpreting the results. Data on advance voters cannot be directly generalised to relate to all persons entitled to vote, who cast their votes. For the time being, it is not possible to present corresponding data on persons entitled to vote who cast their votes on the day of the election.
2.1. Age and sex
In the Parliamentary elections 2015, a total of 1,363,488 persons entitled to vote cast their votes in advance. The advance voting percentage reported by Statistics Finland is 46.1. In the 2011 Parliamentary elections, the corresponding percentage was 45.0 and 1,319,878 persons entitled to vote cast their votes in advance. The advance voting percentage is derived by calculating the share of advance voters among those having voted. In this review, advance voters are examined in relation to persons entitled to vote, so the percentage given are clearly lower than those above. In 2015, 32.2 per cent of persons entitled to vote cast their votes in advance and in the 2011 elections, 31.7 per cent.
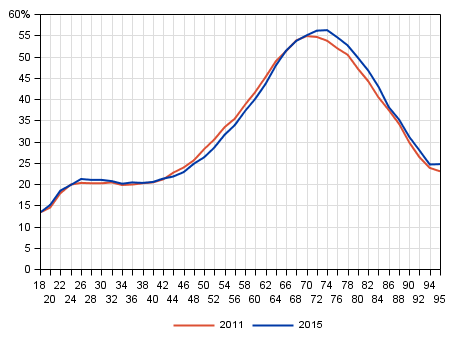
Age clearly has an impact on the probability of advance voting. The share of advance voters among persons entitled to vote remains fairly evenly at around 20 per cent until the age of 40, after which the share of advance voters starts to grow. In 2015, advance voting was in relative terms most common among those aged 73, as 56.3 per cent of the age group voted in advance. In the Parliamentary elections 2011, those aged 71 voted in advance most often, as 55.3 per cent of persons entitled to vote in the age group cast their votes in advance. The relative share of advance voters starts to fall after these ages, as 24.7 per cent of those aged 95 voted in advance in 2015 and 23.0 per cent in the 2011 elections. (Figure 23)
Figure 23. Share of advance voters among persons entitled to vote by age in Parliamentary elections 2011 and 2015, %
In relative terms, women voted in advance more than men in the Parliamentary elections 2011 and 2015. In 2015, 34.2 per cent of women and 30.1 per cent of men entitled to vote voted in advance. The difference between genders is also visible in the 2011 elections, when 33.5 per cent of women entitled to vote and 29.8 per cent of men cast their votes in advance. Examined by age group, women voted in advance more often than men in all age groups, except among those aged 75 or over. (Table 10)
Table 10. Share of advance voters among persons entitled to vote by sex and age in Parliamentary elections 2011 and 2015, %
| Age group | Total | Men | Women | |||
| 2011 | 2015 | 2011 | 2015 | 2011 | 2015 | |
| Total | 31.7 | 32.2 | 29.8 | 30.1 | 33.5 | 34.2 |
| 18-24 | 16.4 | 16.7 | 14.1 | 13.9 | 18.7 | 19.6 |
| 25-44 | 20.5 | 20.7 | 19.3 | 19.5 | 21.8 | 22.0 |
| 45-64 | 34.7 | 33.3 | 32.8 | 31.2 | 36.6 | 35.5 |
| 65-74 | 53.3 | 53.6 | 51.7 | 51.6 | 54.6 | 55.4 |
| 75- | 44.2 | 46.0 | 48.5 | 49.5 | 41.8 | 43.9 |
2.2. Main type of activity, education and family status
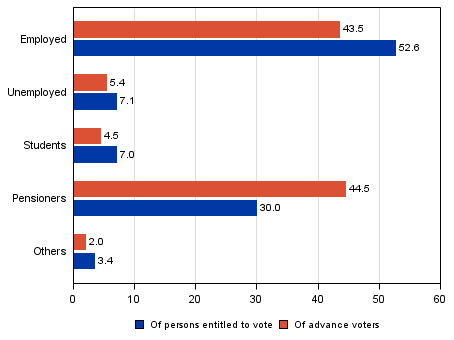
In the Parliamentary elections 2015, the biggest main type of activity among advance voters was formed by pensioners, 44.5 per cent of advance voters. The group includes pensioners and those on unemployment pension. The relative share of pensioners among advance voters has grown by 2.1 per cent from the Parliamentary elections 2011, when employed persons formed the biggest group of advance voters (45.3%). Pensioners are over-represented among advance voters. The share of pensioners among persons entitled to vote is considerably smaller than their share of advance voters. Changes in the advance voting turnout of persons entitled to vote grouped by main type of activity are not great between the Parliamentary elections 2011 and 2015. Changes in the voting practices of the groups largely reflect the change in the size of the groups among persons entitled to vote. (Figures 24 and 25)
Figure 24. Persons entitled to vote and advance voters by main type of activity in Parliamentary elections 2011, %
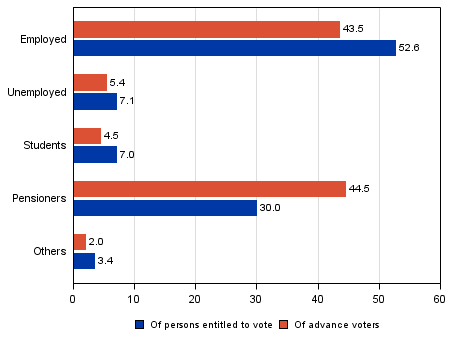
Figure 25. Persons entitled to vote and advance voters by main type of activity in Parliamentary elections 2015, %
High education increases the probability of advance voting. Of persons entitled to vote with basic level education, 31.0 per cent voted in advance in 2011 and 30.8 per cent in the 2015 elections. The share of those with higher tertiary level or doctorate level education among persons entitled to vote was 38.1 per cent of advance voters in 2011 and 38.5 per cent in the 2015 Parliamentary elections. (Table 11)
As noted above (Figure 23), age has a distinct effect on the probability of advance voting. In practice, advance voting becomes more common in all educational groups with age, while the differences between educational groups remain clear. The higher the education, the more often the person entitled to vote has voted in advance. (Table 11)
Table 11. Share of advance voters among persons entitled to vote by age and level of education in Parliamentary elections 2011 and 2015, %
| Educational level | Total | 18-24 | 25-44 | 45-64 | 65-74 | 75- | ||||||
| 2011 | 2015 | 2011 | 2015 | 2011 | 2015 | 2011 | 2015 | 2011 | 2015 | 2011 | 2015 | |
| Total | 31.7 | 32.2 | 16.4 | 16.7 | 20.5 | 20.7 | 34.7 | 33.3 | 53.3 | 53.6 | 44.2 | 46.0 |
| Basic level | 31.0 | 30.8 | 12.0 | 11.9 | 12.0 | 11.4 | 31.2 | 27.9 | 48.4 | 47.8 | 39.9 | 40.8 |
| Upper secondary level | 28.6 | 29.1 | 20.1 | 20.3 | 18.1 | 17.8 | 33.5 | 32.1 | 53.9 | 53.5 | 49.2 | 50.4 |
| Lowest level tertiary | 38.6 | 41.6 | .. | .. | 22.6 | 22.0 | 38.4 | 37.3 | 61.6 | 61.5 | 58.2 | 60.0 |
| Lower-degree level tertiary | 33.8 | 33.6 | 35.1 | 34.7 | 25.0 | 25.6 | 38.8 | 36.2 | 63.3 | 62.7 | 62.6 | 62.9 |
| Higher-degree level tertiary, doctorate | 38.1 | 38.5 | .. | .. | 30.3 | 30.4 | 39.2 | 38.0 | 64.2 | 63.5 | 63.9 | 64.7 |
The biggest change in the share of advance voters by level of education has occurred for those with lowest tertiary level qualifications. This is explained by the decrease in the number of lowest tertiary level qualifications in the population. Lowest tertiary level education covers qualifications above upper secondary level that are not polytechnic degrees. In practice, this means that this educational group will not have any new qualifications in Finland, so the group's age structure differs clearly from other educational groups. In 2011, the 25 to 44 age group of persons entitled to vote covered 25.0 per cent of all having lowest tertiary level qualifications, while in 2015 this figure was 14.0 per cent. Correspondingly, the 65 to 74 group in 2011 included 12.9 per cent of those with lowest tertiary qualifications and 18.9 per cent in 2015. (No table)
Examined by family status, persons without a family are the most active at voting in advance. In 2015, 34.2 per cent of those in the group voted in advance. Married or cohabiting couples also vote in advance more than average, as 33.5 per cent of those belonging to the group cast their votes in advance. In this analysis, single parents refer to parents of one-parent families. In the group of single parents, advance voting is clearly lower than among all persons entitled to vote, as around one-quarter cast their votes in advance in both the elections examined. A youth living at home refers to an adult child living at home with his or her parent. In this group, advance voting is considerably rare compared with all persons entitled to vote, as in 2015 under 19 per cent of them voted in advance. (Figure 26)
Figure 26. Share of advance voters among persons entitled to vote by family status in Parliamentary elections 2011 and 2015, %
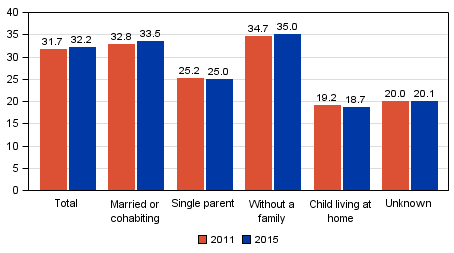
The examination of family status by age group gives a more detailed view of people's advance voting behaviour than presented in Figure 26. Age can yet again be seen to have a clear effect on increasing the probability of advance voting. In all family status categories, the share of advance voters among persons entitled to vote grows with age. Among single parents belonging to the youngest examined age group, those aged 18 to 24, under seven per cent voted in advance in both 2011 and 2015. In all family status categories, except for the group of adult children living at home, advance voting is more common than average starting from the 45 to 64 age group. (Table 12)
Table 12. Share of advance voters among persons entitled to vote by family status and age in Parliamentary elections 2011 and 2015, %
| Family status | Total | 18-24 | 25-44 | 45-64 | 65-74 | 75- | ||||||
| 2011 | 2015 | 2011 | 2015 | 2011 | 2015 | 2011 | 2015 | 2011 | 2015 | 2011 | 2015 | |
| Total | 31.7 | 32.2 | 16.4 | 16.7 | 20.5 | 20.7 | 34.7 | 33.3 | 53.3 | 53.6 | 44.2 | 46.0 |
| Married or cohabiting | 32.8 | 33.5 | 14.7 | 15.9 | 19.0 | 19.3 | 34.7 | 33.1 | 55.2 | 55.6 | 50.8 | 52.9 |
| Single parent | 25.2 | 25.0 | 6.9 | 6.7 | 16.9 | 17.0 | 29.3 | 28.1 | 44.1 | 45.0 | 32.0 | 32.5 |
| Without a family | 34.7 | 35.0 | 18.8 | 20.0 | 24.7 | 24.6 | 36.7 | 35.6 | 50.5 | 50.5 | 41.5 | 42.4 |
| Child living at home | 19.2 | 18.7 | 16.0 | 15.6 | 24.8 | 23.8 | 33.6 | 33.0 | 40.7 | 42.8 | .. | .. |
| Unknown | 20.0 | 20.1 | 13.5 | 12.0 | 19.9 | 18.9 | 25.0 | 25.8 | 29.0 | 31.5 | 13.9 | 13.1 |
2.3. Income level
The income level of persons entitled to vote is examined here by means of the deciles of monetary income subject to state taxation. The income data for 2015 derive from the last taxation from 2013, similarly as the income data for 2011 are from 2009. Income subject to state taxation consists of earned income, entrepreneurial income, and other income subject to state taxation, including such as other earned income, pension income, unemployment benefits and other social security benefits. Income subject to taxation does not include such as grants and awards received from the general government, earned income received from abroad under certain conditions, some social security benefits received from the public sector, and tax-free interest income.
Income deciles are derived by arranging persons entitled to vote by income and by dividing the group into ten equal parts. Each of the formed groups has around 417,000 persons entitled to vote. In the 2015 data, income data are missing from 55,960 persons entitled to vote and in 2011, from 93,548. In the 2015 data, the average income subject to state taxation of persons entitled to vote was EUR 29,329 and in the 2011 data, EUR 26,061. In 2015, the income of the highest-income decile was at least EUR 53,200 and in 2011, EUR 47,600. Correspondingly, the income of the lowest-income decile was in 2015 at most EUR 8,200 and in 2011, at most EUR 6,700. (Table 13)
Table 13. Lowest limits for the income deciles of persons entitled to vote in 2011 and 2015, EUR
| Decile | 2011 | 2015 |
| 1st decile | 0 | 0 |
| 2nd decile | 6,687 | 8,147 |
| 3rd decile | 10,392 | 11,597 |
| 4th decile | 13,718 | 15,378 |
| 5th decile | 17,624 | 19,771 |
| 6th decile | 22,097 | 24,564 |
| 7th decile | 26,386 | 29,264 |
| 8th decile | 30,793 | 34,264 |
| 9th decile | 36,683 | 40,960 |
| 10th decile | 47,575 | 53,247 |
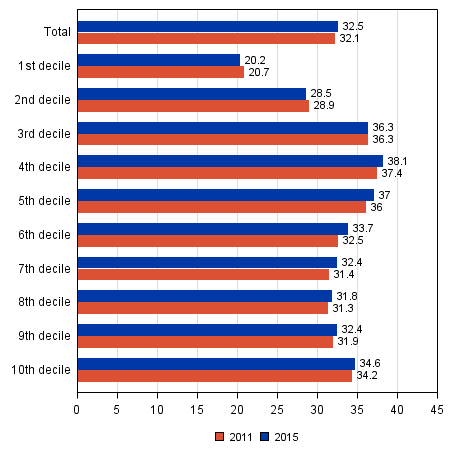
The effect of income on advance voting is not entirely straightforward. On the one hand, those belonging to the lowest income decile vote in relative terms least in advance. Only 20.2 per cent of those belonging to the lowest-income decile voted in advance in the 2015 Parliamentary elections. This share has not essentially changed from the previous Parliamentary elections. On the other hand, advance voting is the most active in the fourth income decile, as 38.1 per cent of those belonging to it voted in advance in the Parliamentary elections 2015. After this, the share of advance voters diminishes until the eighth income decile, after which advance voting becomes more common. In the 2015 elections, 34.6 per cent of those belonging to the highest-income decile voted in advance, the fourth most in all income groups. (Figure 27)
Figure 27. Share of advance voters among persons entitled to vote by income decile in Parliamentary elections 2011 and 2015, %
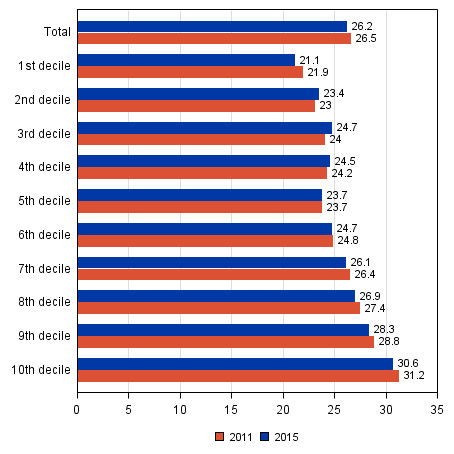
The effect of income level on advance voting is clear among persons entitled to vote belonging to the labour force, aged at most 65. In this analysis, people belonging to the labour force is formed by excluding from the data persons aged 65 or over, students, pensioners, those in military or non-military service, those on unemployment pension and others outside the labour force. The deciles were not re-calculated for this group, so the formed groups are no longer of equal size, but the income limits are as shown in Table 5. In higher income groups, advance voting has as a rule been more general than in lower income groups. Among persons belonging to the labour force, persons entitled to vote in the highest decile voted most often in advance, lower income groups less often. (Figure 28)
Figure 28. Share of advance voters among persons entitled to vote by income decile in Parliamentary elections 2011 and 2015, those belonging to the labour force aged at most 65, %
2.4. Foreign background
In this review, the background of persons entitled to vote and advance voters is viewed by means of language and origin. Only 13.4 per cent of foreign-language speakers entitled to vote voted in advance in the Parliamentary elections 2015. This share is slightly smaller than in the previous elections in 2011. The share of foreign-language speakers having voted in advance is clearly smaller than among those speaking national languages. In 2015, 32.8 per cent of Finnish or Sami speakers and 28.6 per cent of Swedish speakers voted in advance. Examined by sex, the share of advance voters has grown between the elections in all groups except among foreign-language speaking women. However, changes in the advance voting activity of the groups are not major between the 2011 and 2015 Parliamentary elections. (Table 14)
Table 14. Share of advance voters among persons entitled to vote by sex and language in Parliamentary elections 2011 and 2015, %
| Sex | Total | Finnish, Sami | Swedish | Other language | ||||
| 2011 | 2015 | 2011 | 2015 | 2011 | 2015 | 2011 | 2015 | |
| Total | 31.7 | 32.2 | 32.2 | 32.8 | 27.0 | 28.6 | 13.8 | 13.4 |
| Men | 29.8 | 30.1 | 30.3 | 30.7 | 24.8 | 26.2 | 13.6 | 13.7 |
| Women | 33.5 | 34.2 | 34.0 | 34.9 | 29.2 | 30.9 | 13.9 | 13.2 |
Persons whose both parents (or only parent) have been born abroad are defined as persons with foreign background. In the 2015 Parliamentary elections, 1.9 per cent of persons entitled to vote were of foreign background, growing by 0.5 percentage points from the 2011. It should be noted that the share of persons with foreign background in all persons living in Finland is bigger than that, as Finnish citizenship is required from those entitled to vote in the Parliamentary elections. At the end of 2014, 5.5 per cent of the population living in Finland were of foreign background.
Advance voting was clearly less common among persons with foreign background entitled to vote than among persons with Finnish background in both the Parliamentary elections 2011 and 2015. In the youngest examined age group, those aged 18 to 24, just 8.9 per cent of persons with foreign background entitled to vote cast their votes in advance in 2015. In the group of persons with foreign background aged 25 to 44 advance voting was also quite low, only about 11 per cent of those entitled to vote in both the elections examined. Advance voting by persons with foreign background becomes more common with age, but in all the examined age groups it remains clearly below the corresponding figure for people with Finnish background. (Table 15)
Table 15. Share of advance voters among persons entitled to vote by origin and age in Parliamentary elections 2011 and 2015, %
| Age group | Population, total | Finnish background | Foreign background | |||
| 2011 | 2015 | 2011 | 2015 | 2011 | 2015 | |
| Total | 31.7 | 32.3 | 31.9 | 32.6 | 16.8 | 15.5 |
| 18-24 | 16.4 | 16.7 | 16.5 | 16.9 | 8.1 | 8.9 |
| 25-44 | 20.5 | 20.7 | 20.7 | 21.0 | 11.0 | 10.9 |
| 45-64 | 34.7 | 33.3 | 35.0 | 33.7 | 17.6 | 16.1 |
| 65-74 | 53.3 | 53.6 | 53.4 | 53.8 | 39.7 | 34.7 |
| 75- | 44.2 | 46.0 | 44.2 | 46.1 | 36.6 | 37.2 |
Source: Parliamentary Elections 2015, confirmed result, background analysis of candidates and elected MPs. Statistics Finland
Inquiries: Sami Fredriksson 029 551 2696, Kaija Ruotsalainen 029 551 3599, Jaana Asikainen 029 551 3506, vaalit@stat.fi
Director in charge: Riitta Harala
Updated 30.4.2015
Official Statistics of Finland (OSF):
Parliamentary elections [e-publication].
ISSN=1799-6279. 2015,
2. Background analysis of advance voters in the Parliamentary elections 2015
. Helsinki: Statistics Finland [referred: 26.4.2025].
Access method: http://stat.fi/til/evaa/2015/evaa_2015_2015-04-30_kat_002_en.html

