Published: 29 April 2019
In all, 41.5 per cent of the elected MPs in the Parliamentary elections 2019 are new Members of Parliament
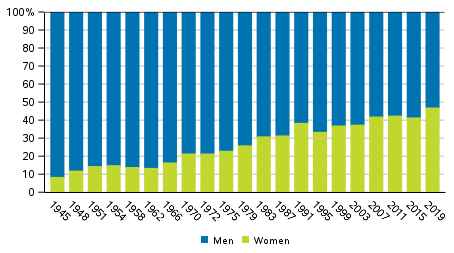
Of the MPs elected in the 2019 Parliamentary elections, 47.0 per cent were women, which is 5.0 percentage points more than among the candidates nominated by the parties. Women's share of elected MPs was bigger than in any previous Parliamentary elections. More detailed data on the candidates and elected councillors of the Parliamentary elections can be found in the review: Background analysis of candidates and elected MPs in Parliamentary elections 2019.
Men and women as percentage of elected MPs in Parliamentary elections 1945 to 2019 (%)

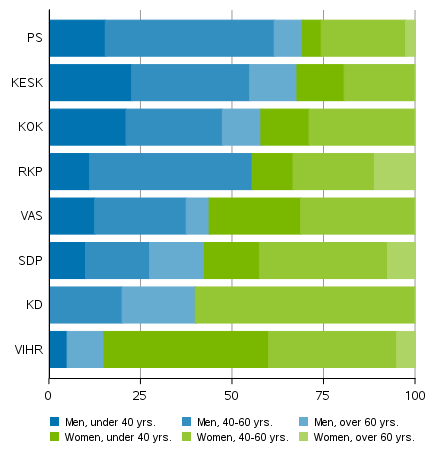
The share of women in parties with representatives in Parliament was biggest for the Green League (85.0%) and smallest for the Finns Party (30.8%). The average age of all MPs elected in the Parliamentary elections was 46.6 years. The average age of the elected men was 48.8 and that of women 44.1 years. The average age of the elected MPs was lowest for the Green League (42.0 years) and highest for the Christian Democrats (56.6 years).
Share of men and women among elected MPs by party and age in Parliamentary elections 2019, parliamentary parties (%)

Of the new Members of Parliament, 85.5 per cent were municipal councillors, 58.5 per cent of the elected MPs retook their seats in the Parliament. The share of persons speaking Finnish or Sami as their native language was 92.5 per cent of the elected MPs and 7.0 per were Swedish speakers. The majority of the elected MPs (96.5%) were employed persons. The median for the disposable income of the elected MPs was over EUR 55,000, over EUR 26,000 more than all candidates.
Table 1. Background analysis of candidates (by party) and elected MPs in the Parliamentary elections 2019
| Members of former Parliament (%) |
Counc. in municipal councils (%) | Average age | Finn. or Sami speakers (%) | Swedish speakers (%) | Other lang. speakers (%) | Employed (%) | Unemployed (%) | In inactive pop. (%) | Avg. income | |
| Candidates total | 6.7 | 40.1 | 46.9 | 91.2 | 6.0 | 2.3 | 72.9 | 8.9 | 18.2 | 29,111 |
| KESK | 17.1 | 58.8 | 45.7 | 95.4 | 1.9 | 2.8 | 90.3 | 1.9 | 7.9 | 39,345 |
| PS | 8.0 | 62.4 | 48.1 | 98.1 | 0.9 | 0.5 | 83.6 | 6.1 | 10.3 | 30,257 |
| KOK | 17.1 | 72.5 | 45.4 | 97.2 | 1.4 | 1.4 | 91.5 | 0.9 | 7.6 | 47,476 |
| SDP | 13.4 | 71.8 | 45.6 | 93.5 | 2.8 | 3.7 | 88.9 | 4.2 | 6.9 | 35,888 |
| VIHR | 5.1 | 60.6 | 41.3 | 94.0 | 2.3 | 3.7 | 86.1 | 5.6 | 8.3 | 30,406 |
| VAS | 4.6 | 51.4 | 44.3 | 93.5 | 2.8 | 3.7 | 77.8 | 13.0 | 9.3 | 27,866 |
| RKP | 7.1 | 46.9 | 44.0 | 7.1 | 91.8 | 1.0 | 83.7 | 1.0 | 15.3 | 36,956 |
| KD | 2.6 | 38.4 | 51.3 | 94.7 | 3.7 | 1.1 | 78.4 | 7.4 | 14.2 | 31,119 |
| NYT | 0.9 | 8.3 | 47.1 | 93.6 | 4.6 | 0.9 | 72.5 | 10.1 | 17.4 | 29,650 |
| Others | 1.5 | 6.6 | 49.1 | 93.7 | 2.6 | 2.4 | 48.1 | 16.0 | 35.9 | 20,012 |
| Elected MPs | 58.5 | 85.5 | 46.6 | 92.5 | 7.0 | 0.5 | 96.5 | 1.5 | 2.0 | 55,401 |
Source: Parliamentary Elections 2019, background analysis of elected MPs. Statistics Finland
Inquiries: Sami Fredriksson 029 551 2696, Kaija Ruotsalainen 029 551 3599, vaalit@stat.fi
Director in charge: Jari Tarkoma
Publication in pdf-format (784.8 kB)
- Reviews
- Tables
-
Tables in databases
Pick the data you need into tables, view the data as graphs, or download the data for your use.
- Quality descriptions
-
- Parliamentary elections, quality description (29.4.2019)
Updated 29.4.2019
Official Statistics of Finland (OSF):
Parliamentary elections [e-publication].
ISSN=1799-6279. Candidates and elected MPs 2019. Helsinki: Statistics Finland [referred: 20.4.2025].
Access method: http://stat.fi/til/evaa/2019/02/evaa_2019_02_2019-04-29_tie_001_en.html

