Published: 5 June 2014
Innovation activity commonest in large enterprises with international operations
According to a EU survey carried out by Statistics Finland the overall picture of innovation activities by enterprises operating in Finland in 2010 to 2012 was similar to what it had been before. In relative terms, large and internationally operating enterprises had the most innovation activity. One-third of enterprises operating on the domestic markets reported innovation activity related to products or processes, while the share of enterprises reporting similar innovation activity among those operating on international markets was 60 per cent.
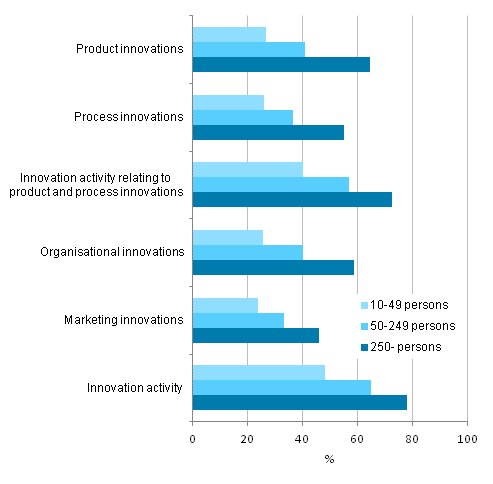
Prevalence of innovation activity by size category of personnel, 2010-2012, share of enterprises

Among the smallest enterprises in the survey, or enterprises employing ten to 49 persons, approximately one-quarter reported they had launched product innovations during the examined period. The share in medium size enterprises was 41 per cent, and in large enterprises, or those employing at least 250 persons, the share was 64 per cent. All in all, almost one-half or 45 per cent of enterprises were involved in innovation activity related to products and processes, the share being 40 per cent for smaller enterprises, 57 per cent for medium size enterprises and 73 per cent for large enterprises. Large enterprises also reported adoption of new marketing and organisational innovations more often than smaller enterprises.
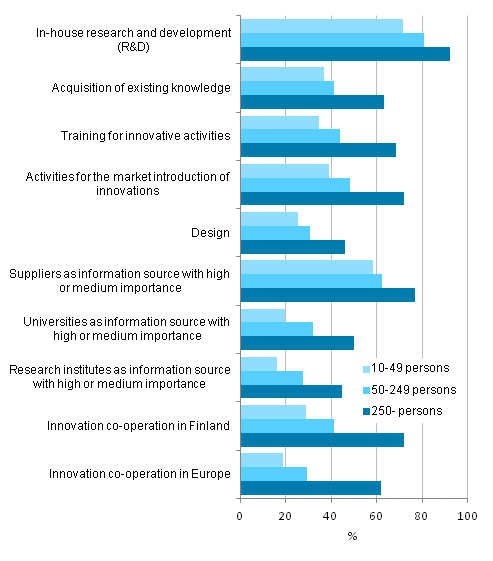
Innovation activity relating to products and processes by size category of personnel, 2010-2012, share of enterprises with innovation activity relating to products and processes

Among the companies that reported innovation activity, the intensity of the activity increased with the size of the enterprise. Large enterprises reported various kinds of innovation activity more often than smaller enterprises, and different data sources and cooperation partners in innovation activity were more commonly seen as important by large enterprises than by small enterprises. Large enterprises also reported that they had received public funding for their innovation activity more often than smaller enterprises.
Being a forerunner, the complexity of products and confidentiality are more widely recognised ways to promote and maintain the competitiveness of innovations than formal protective measures. Four out of five of those who had taken product or process innovations into use in 2010 to 2012 felt that being a forerunner is an important (high or moderate importance) protective measure, and more than one-half believed that confidentiality and the complexity of products was of high or moderate importance when ensuring the competitiveness of the innovation. Patenting, registration of the copyright of design and, for example, copyrights are, based on the results, alternative protective measures for clearly fewer enterprises.
All in all, nearly one-third of the enterprises included in the study had procurement contracts in 2010 to 2012 to provide products to the public sector, either to domestic or foreign public sector organisations. Eight per cent of enterprises that had procurement contracts reported that they had pursued innovation activity as part of the procurement contract so that innovation was required in the contract. A total of 16 per cent of enterprises that had a procurement contract reported of innovation activity related to implementing the procurement contract without innovation being required in the contract.
Innovation activity related to procurement contracts was commonest in computer programming activities, architectural and engineering activities, and information services activities – in each of these sectors more commonly so that innovation activity was not required in the procurement contract.
Source: Innovation 2012, Statistics Finland
Inquiries: Mervi Niemi 09 1734 3263 (9.6.2014 => 029 551 3263), tiede.teknologia@stat.fi
Director in charge: Hannele Orjala
Publication in pdf-format (624.2 kB)
- Reviews
-
- 1. About the Innovation Survey (5.6.2014)
- 2. Prevalence of innovation activity in enterprises in 2010 to 2012 (5.6.2014)
- 3. Innovation activity related to products and processes in 2010 to 2012 (5.6.2014)
- 4. Implementation of marketing and organisational innovations in 2010 to 2012 (5.6.2014)
- 5. Public procurement and innovation activity (5.6.2014)
- Tables
-
Tables in databases
Pick the data you need into tables, view the data as graphs, or download the data for your use.
Appendix tables
- Appendix table 1. Prevalence of innovation activity by form of enterprise, 2010 - 2012, share of enterprises (5.6.2014)
- Appendix table 2. Prevalence of innovation activity by enterprise's primary position in the production value chain 2010 - 2012, share of enterprises (5.6.2014)
- Appendix table 3. Prevalence of innovation activity by enterprise's geographic markets 2010 - 2012, share of enterprises (5.6.2014)
- Appendix table 4. Prevalence of marketing and organisational innovations by form of enterprise, 2010 - 2012, share of enterprises (5.6.2014)
- Appendix table 5. Prevalence of marketing and organisational innovations by enterprise's primary position in the production value chain 2010 - 2012, share of enterprises (5.6.2014)
- Appendix table 6. Prevalence of marketing and organisational innovations by enterprise's geographic markets 2010 - 2012, share of enterprises (5.6.2014)
- Appendix table 7. Developers of goods innovations by size category of personnel, 2010 - 2012, share of enterprises with goods innovations (5.6.2014)
- Appendix table 8. Developers of goods innovations by industry, 2010 - 2012, share of enterprises with goods innovations (5.6.2014)
- Appendix table 9. Developers of service innovations by size category of personnel, 2010 - 2012, share of enterprises with service innovations (5.6.2014)
- Appendix table 10. Developers of service innovations by industry, 2010 - 2012, share of enterprises with service innovations (5.6.2014)
- Appendix table 11. Enterprises with product innovations by degree of novelty of innovations and size category of personnel, 2010 - 2012, share of enterprises with product innovations (5.6.2014)
- Appendix table 12. Enterprises with product innovations by degree of novelty of innovations and industry, 2010 - 2012, share of enterprises with product innovations (5.6.2014)
- Appendix table 13. Proportions of product innovations and unchanged products of turnover by size category of personnel, 2012 (5.6.2014)
- Appendix table 14. Proportions of product innovations and unchanged products of turnover by industry, 2012 (5.6.2014)
- Appendix table 15. Developers of process innovations by size category of personnel, 2010 - 2012, share of enterprises with process innovations (5.6.2014)
- Appendix table 16. Developers of process innovations by industry, 2010 - 2012, share of enterprises with process innovations (5.6.2014)
- Appendix table 17. Innovation expenditure, 2012, EUR million (5.6.2014)
- Appendix table 18. Co-operation in innovation activity by location of co-operating partner, 2010 - 2012, share of enterprises with innovation activity relating to products and processes (5.6.2014)
- Appendix table 19. Methods for maintaining or increasing competitiveness of product and process innovations, 2010 - 2012, importance of methods, share of enterprises with product or process innovations (5.6.2014)
- Appendix table 20. Methods for maintaining or increasing competitiveness of product and process innovations with high or medium importance by size category of personnel, 2010 - 2012, share of enterprises with product or process innovations (5.6.2014)
- Appendix table 21. Public sector procurement and innovations 2010 - 2012, share of enterprises (5.6.2014)
- Appendix table 22. Public sector procurement and innovations by industry, 2010 - 2012, share of enterprises (5.6.2014)
Updated 5.6.2014
Official Statistics of Finland (OSF):
Innovation [e-publication].
ISSN=1797-4399. 2012. Helsinki: Statistics Finland [referred: 20.4.2025].
Access method: http://stat.fi/til/inn/2012/inn_2012_2014-06-05_tie_001_en.html

