2. Prevalence of innovation activity in enterprises in 2010 to 2012
Good one-half of the surveyed enterprises, or 55 per cent, reported that they had innovation activity in 2012 to 2014. This was at the same level as in the previous surveys, as the share was 53 per cent for 2010 to 2012 and 56 per cent for 2008 to 2010.
A majority of those involved in innovation activity had developed or introduced product or process innovations. Now, 48 per cent of the surveyed enterprises reported activities related to product and process innovations, while in the previous surveys, the corresponding shares were 45 and 46 per cent. The share of enterprises that had adopted organisational and marketing innovations remained on level with the previous survey, being 30 and 26 per cent of enterprises. Adoptions of organisational or marketing innovations were most commonly reported by enterprises who also had innovation activity related to products or processes.
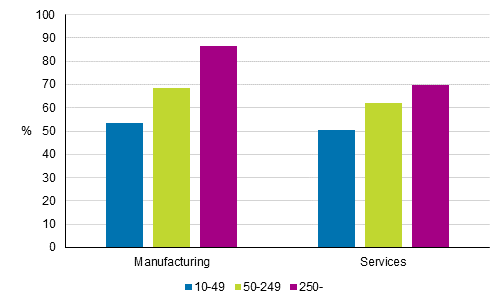
The overall picture of the prevalence of innovation activity has remained similar to the results of the previous surveys. Manufacturing enterprises are generally involved in innovation activity related to products and processes more commonly than service industry enterprises. In manufacturing, the share of enterprises that had developed or adopted product or process innovations was 52 per cent, while in the service industries the share was 45 per cent of enterprises. All in all, 58 per cent of manufacturing enterprises and 53 per cent of service industry enterprises had innovation activity.
An examination by size category shows that large enterprises still innovate more commonly than smaller enterprises. Especially in manufacturing, the differences between size categories are clear in reporting of innovation activity. The share of those that had innovated products and processes in the smallest enterprise size category was 46 per cent in manufacturing, while among enterprises employing at least 250 persons, 85 per cent reported innovation activity. In the service industries, the differences are smaller – among smaller size enterprises, 43 per cent had innovation activity related to products and processes, while among bigger enterprises, the share was 59 per cent. Among the smallest examined service industry enterprises, the share of those that reported innovation activity rose so that it was close to the level reported among the smallest manufacturing enterprises.Figure 1. Prevalence of innovation activity related to products and processes by size category of enterprise in manufacturing and services in 2012 to 2014, share of enterprises
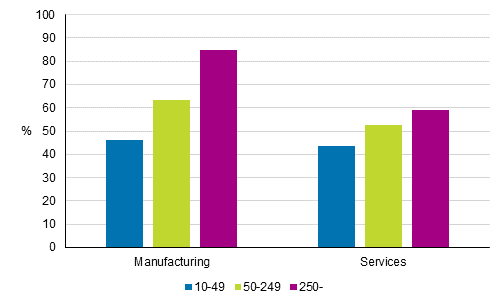
Figure 2. Prevalence of innovation activity (incl. marketing and organisational innovations) by size category of enterprise in manufacturing and services in 2012 to 2014, share of enterprises
In manufacturing, innovation activities were most prevalent in the manufacture of computer, electronic and optical products, manufacture of chemicals and chemical products, and manufacture of textiles. Among these, the share of those involved in innovation activity has also been high in previous surveys for the first mentioned industries.
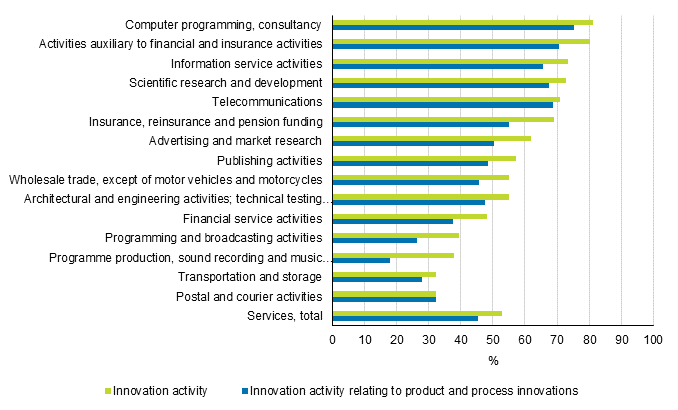
Correspondingly, in service industries, innovation was reported most among enterprises in software production, operations serving financing and insurance, and information service activities, telecommunications, as well as research and development. These industries were also the industries where innovation activity was most prevalent in the previous survey.Figure 3. Prevalence of innovation activity by industry in manufacturing in 2012 to 2014, share of enterprises
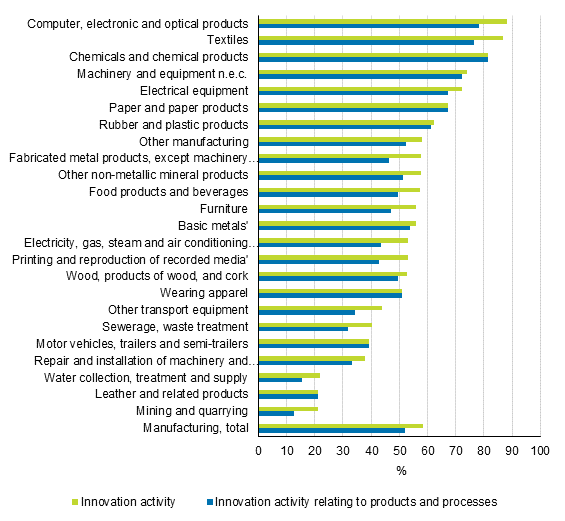
Figure 4. Prevalence of innovation activity by industry in service industries in 2012 to 2014, share of enterprises
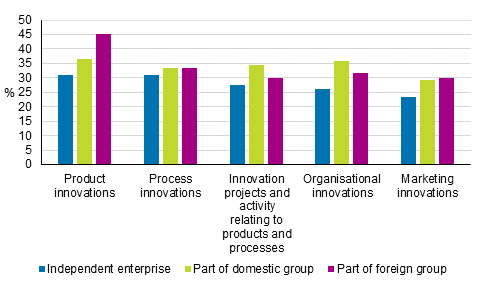
In line with previous years, enterprises belonging to groups reported more innovation activity than independent enterprises not belonging to any group in 2012 to 2014. Altogether, 53 per cent of independent enterprises reported innovation activity, for enterprises belonging to Finnish groups the corresponding share was 57 per cent and 61 per cent for enterprises belonging to international groups. Enterprises belonging to international groups stood out particularly in the prevalence of introducing product innovations to the market, as the share of enterprises reporting product innovations was 45 per cent among these, while the share of independent enterprises was 31 per cent and that of enterprises belonging to Finnish groups was 36 per cent.
Figure 5. Prevalence of innovation activity by form of enterprise in 2012 to 2014, share of enterprises
Innovation activity also became more commonplace the wider the geographical markets on which the enterprise sells its products are. Close on 40 per cent of enterprises operating only on the domestic markets, reported innovation activity related to products and processes in 2012 to 2014 and nearly one-third reported adoption of non-technological innovations. Among enterprises that operate on the EU markets, the corresponding shares of enterprises with innovation activity were 55 and 44 per cent. Among enterprises that sell products and services outside the EU, innovation activity was reported by 64 per cent (innovation activity related to products and processes) and 50 per cent (organisational and marketing innovations).
The results of the survey by various background variables – size of personnel, industry and manufacturing and services total, form of enterprise and geographical market of products – can be found in more detail on the home page of the statistics in database tables and in the appendix tables of this review.
Source: Innovation 2014, Statistics Finland
Inquiries: Mervi Niemi 029 551 3263, Heidi Pirkola 029 551 3246, tiede.teknologia@stat.fi
Director in charge: Mari Yl�-Jarkko
Updated 2.6.2016
Official Statistics of Finland (OSF):
Innovation [e-publication].
ISSN=1797-4399. 2014,
2. Prevalence of innovation activity in enterprises in 2010 to 2012
. Helsinki: Statistics Finland [referred: 19.4.2025].
Access method: http://stat.fi/til/inn/2014/inn_2014_2016-06-02_kat_002_en.html

