Published: 30 September 2009
Revised EMU deficit and debt figures for 2008 released
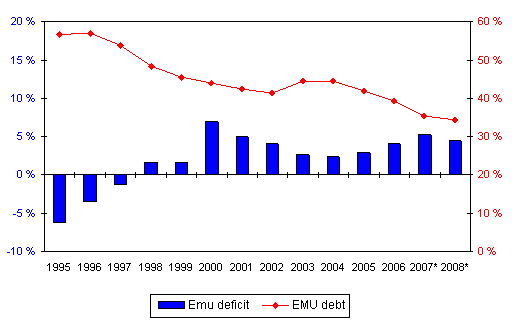
According to Statistics Finland’s revised preliminary data, the general government’s EMU surplus amounted to EUR 8.2 billion, of 4.5 per cent of GDP in 2008, while the respective figures in 2007 were EUR 9.4 billion and 5.2 per cent of GDP. The central government sector’s surplus decreased by EUR 2.1 billion from the year before to EUR 1.7 billion. The local government sector continued to show a slight deficit, which in 2008 amounted to EUR 0.4 billion. Employment pension funds accumulated a surplus of EUR 6.8 billion. The surplus of other social security funds amounted to EUR 0.1 billion.
The amount of general government EMU debt contracted by EUR 0.2 billion to EUR 63.0 billion during 2008. Central government debt decreased by EUR 0.5 billion whereas local government debt grew by EUR 0.3 billion. At the same time, the GDP share of the EMU debt fell to 34.1 per cent from the previous year’s 35.2 per cent.
Compared to the preliminary data on 2008 released in March 2009, general government surplus became revised upwards by EUR 0.5 billion and general government debt by EUR 0.9 billion. The size of the EMU debt was pushed up by the reclassification of margin deposits received by central government from its derivative contract counterparts. They are now classified as short-term loans, but were previously included in statistics as other accounts payable which do not fall within the scope of the definition of EMU debt. At the end of 2008, the margin deposits amounted to EUR 1.0 billion.
The figures derive from the data reported by Statistics Finland to the European Commission in September.
Finland's general government EMU deficit (-) and debt, percentage of GDP

Source: General government deficit and gross debt according to EMU criteria, 2008, Statistics Finland
Inquiries: Mika Sainio (09) 1734 2686, Matti Okko (09) 1734 3341, rahoitus.tilinpito@stat.fi
Director in charge: Ari Tyrkkö
Publication in pdf-format (266.6 kB)
- Tables
-
Tables in databases
Pick the data you need into tables, view the data as graphs, or download the data for your use.
Appendix tables
- EMU deficit of Finnish government 1975-2008 1) (30.9.2009)
- General government EMU debt 1975-2008 1) (30.9.2009)
- Finnish general government gross debt and EMU debt 1995-2008 1) (30.9.2009)
- Comparison of central government net lending and on-budget entities net financing requirement, EUR billion 1) (30.9.2009)
- Comparison of local government net lending and the annual margin in the profit and loss statement of local government, EUR billion 1) (30.9.2009)
- Comparison of the net lending of the sub-sector Social security funds and the deficit/surplus of funds, EUR billion 1) (30.9.2009)
- Items influencing the changes in EMU debt, EUR billion 1) (30.9.2009)
- EDP reporting tables, October 2009 notification (updated 30.9.2009) (Excel) (30.9.2009)
Updated 30.09.2009
Official Statistics of Finland (OSF):
General government deficit and debt [e-publication].
ISSN=1799-5914. 2008. Helsinki: Statistics Finland [referred: 20.4.2025].
Access method: http://stat.fi/til/jali/2008/jali_2008_2009-09-30_tie_001_en.html

