Published: 15 January 2020
More municipal waste was generated in 2018 than in previous years
Corrected on 17 January 2020. The correction is indicated in red.
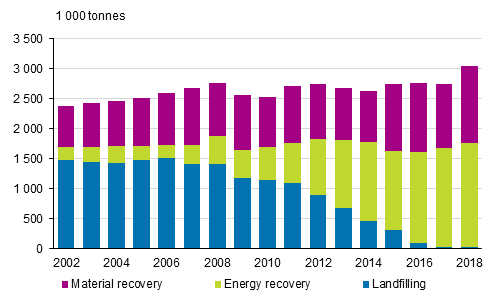
The total amount of municipal waste was around three million tonnes in 2018. Growth from the previous year amounted to nearly 230,000 tonnes, which denotes an increase of around eight per cent in the total amount. No great changes took place in the mutual shares of treatment modes of waste. The amount of waste corresponded to around 550 kg calculated per inhabitant.
The total amount of municipal waste was 3,041,082 tonnes in 2018. The amount is around eight per cent, that is, 229,000 tonnes more than in the previous year. There has not been a corresponding growth in the amount of municipal waste prior to the statistical reference year 2018.
Treatment of waste was still focused on energy recovery
No great changes took place in the mutual shares of treatment modes of waste. Energy recovery of waste was still the most significant treatment mode of municipal waste, although its share fell slightly, to 57 per cent. Energy recovery of municipal waste is based on combined production of electricity and heat, and heat is particularly recovered in district heating networks.
Municipal waste by treatment method in 2002 to 2018

The share of material recovery of waste grew, being 42 per cent. Landfill disposal of waste has ceased almost completely: its share was only around 0.7 per cent in 2018. This is partly due to the landfill prohibition of organic waste that came into force in 2016, which has channelled waste to energy recovery.
Amount of mixed waste grew significantly, but recycling of wood and plastic also increased
When examining different waste components, the share of mixed waste grew particularly. Municipalities produced around 1.5 million tonnes of mixed waste, which was over 20 per cent more than in 2017. The production of non-specified waste components was slightly smaller than in the year before, which can partly explain a small part of the growth in mixed waste. Nearly the same amount of waste collected separately as material was produced as in previous years, around 1.4 million tonnes.
Of separately collected waste components, wood and plastic were recovered more than in previous years. The considerable increase in recycling of wood packages is due to new recycling objects and the growth in the amount composted. Recycling of glass also increased.
Paper and paperboard and biowaste have long been the biggest separately collected material items. The recycling rate of cardboard, paper and paperboard was fairly high, calculated at over 100 per cent. This is due to packages from passenger imports and online shop orders and the effect of enterprises with lower turnover in the calculation method. Most of biowaste was composted and decomposed; in all, the amount composted and decomposed grew by around eight per cent from the previous year. Decomposition produces biogas, in addition to which the decomposition residue and compost soil can be utilised in soil improvement or landscape development.
Amount of municipal waste per inhabitant grew
The amount of waste also grew relative to Finland's population. In the early 2010s, the amount of waste settled to around 2.7 million tonnes, which was around 500 kg per inhabitant. In 2018, the amount of municipal waste grew to around 550 kg per person. Municipal waste refers to waste generated in housing as well as comparable waste from trade and services and corresponding waste from manufacturing support activities.
Source: Waste statistics, Statistics Finland
Inquiries: Heidi Pirtonen 029 551 3093, Juha Espo 029 551 3463, ymparistotilinpito@stat.fi
Director in charge: Ville Vertanen
Publication in pdf-format (201.0 kB)
- Tables
-
Tables in databases
Pick the data you need into tables, view the data as graphs, or download the data for your use.
Appendix tables
- Municipal waste 2018, tonnes (15.1.2020)
Updated 15.1.2020
Official Statistics of Finland (OSF):
Waste statistics [e-publication].
ISSN=2323-5314. 2018. Helsinki: Statistics Finland [referred: 20.4.2025].
Access method: http://stat.fi/til/jate/2018/jate_2018_2020-01-15_tie_001_en.html

