Published: 17 June 2020
Amount of waste generated in 2018 returned to the level of 2016 – the share of waste recovered as material grew slightly
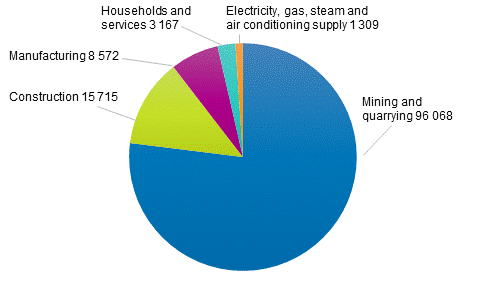
A total of 128 million tonnes of waste were generated in 2018. This was 11 million tonnes more than in the previous year, when the amount of waste had fallen mainly due to decreased waste caused by mineral excavation. The growth in 2018 was again mostly explained by increased mineral excavation. The amount of waste from mining and quarrying grew by around seven million tonnes to a total of 96 million tonnes.
Waste generated by sector and type in 2018, 1,000 tonnes per year

Mineral waste accounted for around 90 per cent of the total amount of waste. In addition to mining and quarrying, mineral waste was generated especially in construction, where the majority of the waste was landfilled surplus soil. The amount of mineral waste generated in construction was 0.8 million tonnes higher than in the year before, in total 15 million tonnes.
The total amount of waste in industrial production and energy supply grew from 8.8 to 9.9 million tonnes.
As in previous years, the combined volume of waste generated by services and households grew slightly, by 145 thousand tonnes, totalling 3,167 million tonnes. A larger share of this growth concerned services and administration.
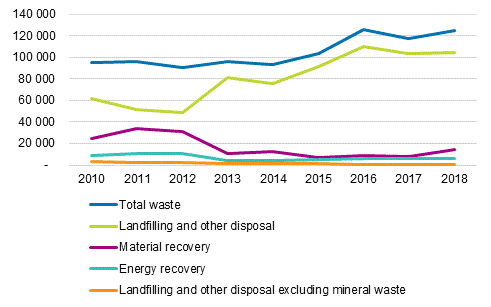
Methods of waste treatment in 2010 to 2018, 1,000 tonnes per year

The amounts of waste treatment followed the growth in the amount of waste. Most of the waste to be treated was mineral waste deposited in mining areas, although they were also utilised as material more than in previous years – 14.5 million tonnes. Mineral waste can be utilised, for example, in earthworks.
Examined without mineral waste, 61 per cent of the waste was recovered as energy. This waste was mainly wood waste and mixed waste, such as household waste. The share of material recovery grew slightly from the year before, from 28 to 33 per cent. Only five per cent of other than mineral waste ended up at landfills.
Source: Waste statistics 2018, Statistics Finland
Inquiries: Juha Espo 029 551 3463, Heidi Pirtonen 029 551 3583, ymparistotilinpito@stat.fi
Director in charge: Ville Vertanen
Publication in pdf-format (231.3 kB)
- Tables
-
Tables in databases
Pick the data you need into tables, view the data as graphs, or download the data for your use.
Appendix tables
Updated 17.6.2020
Official Statistics of Finland (OSF):
Waste statistics [e-publication].
ISSN=2323-5314. 2018. Helsinki: Statistics Finland [referred: 19.4.2025].
Access method: http://stat.fi/til/jate/2018/jate_2018_2020-06-17_tie_001_en.html

