Published: 18 November 2016
Mass media market contracted – a good year for cinemas
The value of the mass media market fell again compared to the previous year. In 2015, the value of the mass media market amounted to around EUR 3.7 billion. This was around EUR 100 million or about three per cent less than in the year before.
However, there was some growth in a few industries. Among mass media market industries, particularly cinemas (+26%), Internet advertising (+7%), book sales (+4%) and commercial radio (+4%) grew in 2015.
Mass media market in 2014 to 2015, EUR million
| 2014, EUR mill. | 2015, EUR mill. | 2015, % | Change, 2014-15, % | |
| Daily newspapers (7-4 times a week) 1) | 874 | 830 | 22,3 | -5,0 |
| Other newspapers 1) | 130 | 132 | 3,5 | 1,8 |
| Free-distribution papers 1) | 73 | 71 | 1,9 | -2,3 |
| Magazines and periodicals 1) | 550 | 505 | 13,5 | -8,2 |
| Books 1) | 548 | 570 | 15,3 | 4,0 |
| Publishing, total | 2 174 | 2 108 | 56,5 | -3,0 |
| Television 2) | 1 102 | 1 060 | 28,4 | -3,8 |
| Radio | 60 | 63 | 1,7 | 3,9 |
| Internet advertising | 268 | 286 | 7,7 | 6,8 |
| Electronic media, total | 1 430 | 1 409 | 37,8 | -1,5 |
| Phonograms 1) | 58 | 58 | 1,6 | 0,6 |
| Videos | 99 | 61 | 1,6 | -38,1 |
| Cinemas | 75 | 94 | 2,5 | 26,0 |
| Recorded media, total | 232 | 214 | 5,7 | -7,8 |
| All total | 3 836 | 3 731 | 100 | -2,7 |
2) Also includes YLE public service radio.
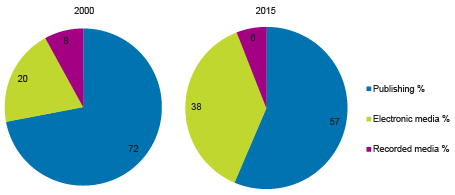
The value of electronic media went down by 1.5 per cent. The media market share of electronic media has, however, doubled in this millennium from around one fifth to nearly 40 per cent. The media market share has grown by Internet advertising and particularly by the television business.
Mass media market in 2000 to 2015 (%)

Publishing (incl. newspapers and free-distribution papers, magazines and periodicals, and books) went down by three per cent from the previous year. The media market share of publishing has gone down in this millennium from over 70 to 57 per cent. In 2015, the drop was biggest for magazines and periodicals, whose market contracted by over eight per cent from the previous year.
In the recording market, the sales of video recordings fell further. Cinemas, in turn, have had a good year with regard to ticket sales and development of cinema advertising.
Differing from previous years, the calculation of mass media market for 2015 does not include direct mail. In the calculation for 2015, direct mail was removed from previous statistical reference years as well. The mass market share of direct mail has gone down in this millennium from around nine per cent in 2000 to about five per cent in 2014.
The calculations presented here describe the mass media market at end user level: for example, the figure on the newspaper market is comprised of retail priced subscription and single copy sales of newspapers, and their revenue from advertising. The figures cover domestic production and imports but not exports. There is some overlap between Internet advertising and other media groups.
Source: Mass media and cultural statistics. Statistics Finland
Inquiries: Kaisa Saarenmaa 029 551 3517, Tuomo Sauri 029 551 3449, joukkoviestimet.tilastokeskus@stat.fi
Director in charge: Jari Tarkoma
Publication in pdf-format (232.3 kB)
- Tables
-
Tables in databases
Pick the data you need into tables, view the data as graphs, or download the data for your use.
Appendix tables
- Appendix table 1. Sector shares of the mass media market 2000 - 2015, per cent (18.11.2016)
- Appendix table 2. Breakdown of newspaper sales 2000 - 2015, per cent (Corrected on 5 July 2018) (18.11.2016)
- Appendix table 3. Breakdown of magazine sales 2000 - 2015, per cent (18.11.2016)
- Appendix table 4. Radio advertising 2000 - 2015, per cent (18.11.2016)
- Appendix table 5. Television (terrestrial + cable + satellite) revenue 2000 - 2015, per cent (18.11.2016)
Updated 18.11.2016
Official Statistics of Finland (OSF):
Mass media statistics [e-publication].
ISSN=2323-6345. 2015. Helsinki: Statistics Finland [referred: 10.3.2025].
Access method: http://stat.fi/til/jvie/2015/jvie_2015_2016-11-18_tie_001_en.html

