Published: 27 September 2019
Consumers’ estimates about economic growth and unemployment ever gloomier
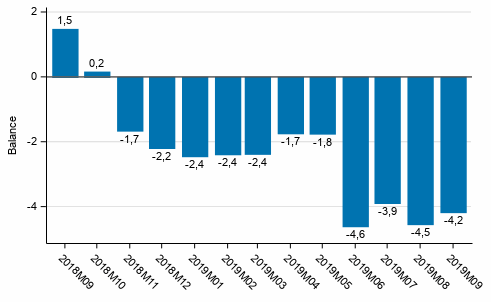
Consumers’ confidence in the economy remained almost unchanged in September. The consumer confidence indicator (CCI) stood at -4.2 in September, having been -4.5 in August and -3.9 in July. Last year in September, the CCI received the value 1.5. The average for the CCI since January 2018 is -0.2. The data are based on Statistics Finland’s Consumer Confidence Survey, to which 1,012 persons resident in Finland responded between 1 and 18 September. The survey methods were revised in May.
Consumer confidence indicator (CCI)

Of the four components of the CCI, expectations on the development of Finland’s economy became still gloomier in September. In turn, the assessment concerning consumers’ own current economic situation and also the situation in the near future improved compared to August. However, the expectations remained subdued. In September, consumers’ intentions to spend money on durable goods increased slightly and there were more such intentions than average.
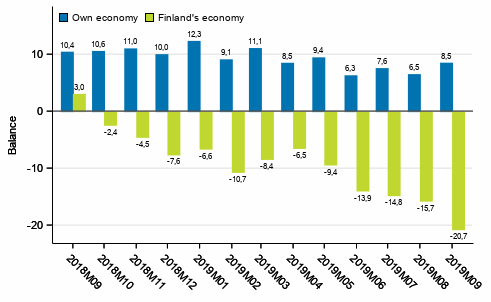
Compared with the corresponding period last year, the expectations on both the own and Finland’s economy weakened in September. The view on Finland’s economy absolutely plummeted over the year. The other components of the CCI improved slightly.
Consumers' expectations concerning their own and Finland's economy in 12 months' time

In September, consumers foresaw more and more clearly that Finland’s unemployment situation will weaken in the future. Furthermore, employed consumers felt that their personal threat of unemployment has also increased considerably in recent times. On the other hand, nearly every second employed person did not experience any threat.
In September, consumers considered their own financial situation to be good. The time was, in general, regarded favourable for raising a loan but not for buying durable goods and especially not for saving.
Consumer confidence by major region and population group
In September, consumers' confidence in the economy was strongest in Greater Helsinki (CCI -1.3) and Northern Finland (-1.3) and weakest in Western Finland (-6.8). Among population groups, students were most optimistic (6.7). In September, pensioners (-15.4) and unemployed persons (-12.2) had the gloomiest expectations concerning economic development. Confidence in the economy usually lessens with the person’s age. Correspondingly, the confidence usually strengthens with education and income. More detailed information is found in the Database tables .
EU results
The (seasonally adjusted) survey results concerning economic expectations for all EU countries are released monthly on the European Commission website: Press releases .
Concepts
The balance figures are obtained by deducting the weighted proportion of negative answers from that of positive answers. The consumer confidence indicator (CCI/A1) is the average of the balance figures for the CCI components. The components of the CCI are: consumer's own economy now (B1), consumer's own economy in 12 months (B2), Finland's economy in 12 months (B4) and consumer's spending money on major purchases in the next 12 months compared to the past 12 months (E1). The balance figures and the confidence indicator can range between -100 and +100 – the higher (positive) balance figure, the brighter the view on the economy.
Source: Consumer Confidence 2019, September. Statistics Finland
Inquiries: Pertti Kangassalo 029 551 3598, Tuomas Parikka 029 551 3276, consumer.confidence@stat.fi
Director in charge: Jari Tarkoma
Publication in pdf-format (319.1 kB)
- Reviews
-
- Review (27.9.2019)
- Tables
-
Tables in databases
Pick the data you need into tables, view the data as graphs, or download the data for your use.
Appendix tables
- Figures
-
- Appendix figure 1. Consumer confidence indicator (CCI) (27.9.2019)
- Appendix figure 2. Own economy (27.9.2019)
- Appendix figure 3. Finland's economy (27.9.2019)
- Appendix figure 4. Inflation (27.9.2019)
- Appendix figure 5. Unemployment (27.9.2019)
- Appendix figure 6. Favourability of time for (27.9.2019)
- Appendix figure 7. Own financial situation and saving possibilities (27.9.2019)
- Appendix figure 8. Intention to raise a loan, next 12 months (27.9.2019)
- Appendix figure 9. Spending on durables, next 12 months vs. last 12 months (27.9.2019)
- Appendix figure10. Intentions to buy, next 12 months (27.9.2019)
Updated 27.9.2019
Official Statistics of Finland (OSF):
Consumer Confidence [e-publication].
ISSN=2669-8889. September 2019. Helsinki: Statistics Finland [referred: 18.4.2025].
Access method: http://stat.fi/til/kbar/2019/09/kbar_2019_09_2019-09-27_tie_001_en.html

