Weight structure and commodity basket of the Consumer Price Index are updated for the year 2018
Weight structure
The weight structure of the Consumer Price Index 2015=100 is based on national accounts data on private consumption. The data are updated annually. The weight structure for 2018 corresponds to the value of private consumption in 2017, which was EUR 104 billion.
National accounts data on consumption expenditure are only available at a rough level. To the extent that the division of consumption items is not accurate enough, the weight of the rough level is divided into sub-items, primarily with the help of the Household Budget Survey. In addition, sub-items are defined by using statistical data produced by other statistics, the Bank of Finland's statistics and sales data of central retail corporations and unions.
The weights of the Consumer Price Index are composed of the value of goods and services bought by households in Finland. Households also include the consumption of tourists in Finland and institutional households. The concept of private consumption in the Consumer Price Index differs from the concepts used in national accounts and the Household Budget Survey and its coverage is also different. Further information about consumption of the Consumer Price Index can be found in Consumer Price Index 2015=100 Handbook for users, p. 9.
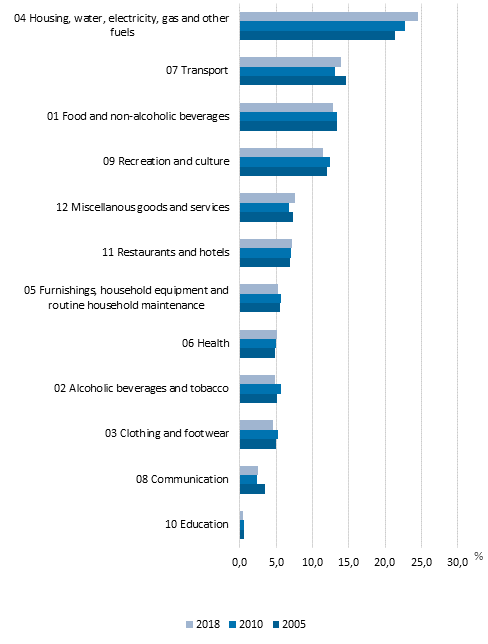
Figure 1. Value shares of total consumption by commodity group in 2005, 2010 and 2018, per cent of total concumption

The figure compares three different base years. Group 04 Housing, water, electricity, gas and other fuels has had the biggest weight values in the past ten years. The value share of group 01 Food and non-alcoholic beverages is still falling.
Commodity basket
The index calculation is based on a commodity basket that is updated annually along with changes taking place in consumption. Commodities whose consumption is at least one per mil or more of total consumption are added to the commodity basket and commodities whose value share has fallen under one per mil of total consumption are removed. With the help of commodities that are now updated annually and their value shares, the representation of the most typical products and services in the Index is ensured. Previously, prior to 2013, the weight structure of the Consumer Price Index was updated every five years.
In 2016, an updated commodity classification was taken into use in the Consumer Price Index (eCOICOP, European Classification of Individual Consumption According to Purpose). The commodity classification is based on the UN's Classification of Individual Consumption According to Purpose, from which a commodity classification was formed for the use inside the EU. In the latest update, the commodity classification was specified to the 5-digit level, for which reason Finland's commodity basket was also renewed and the classification coding was updated.
From the beginning of 2018, the commodities added to the commodity basket were veggie burger, protein bar, music streaming services, and strong cider, strong long drink and strong beer that are included in the selection of retail shops as a result of the Alcohol Act of 1 January 2018. Due to decreased consumption, the items removed from the commodity basket were ready-made hamburger, cooking margarine, repair of a washing machine, landline telephone call charges, video camera, photo service and entertainment events.
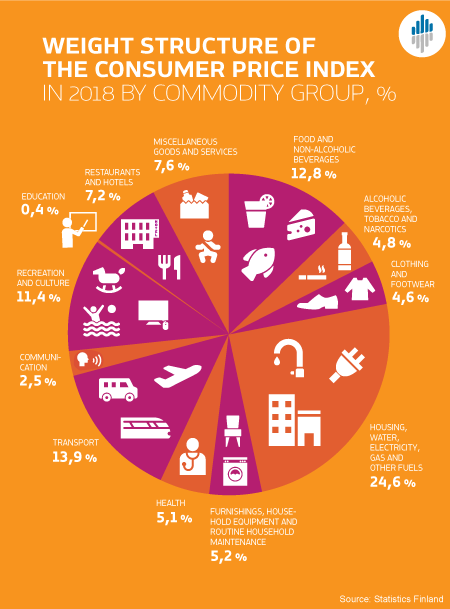
After the update, the commodity basket contains 467 products and services. Figure 2 presents the structure of private consumption by commodity group.
Figure 2. Structure of consumption used in the calculation of the Consumer Price Index in 2018 by commodity group, per cent of total consumption

The biggest changes in private consumption compared to the previous year were in the groups:
07 Transport – relative growth in value share 3.6 per cent
11 Restaurants and hotels – relative growth in value share 3.0 per cent
06 Health – relative fall in value share 3.4 per cent
01 Food and non-alcoholic beverages – relative fall in value share 2.4 per cent
04 Housing, water, electricity, gas and other fuels – relative fall in value share 1.6 per cent
Changes in the prices of commodities in the group having grown their value shares have now more effect on the Consumer Price Index than before. Correspondingly in groups where the value shares dropped, the changes in these prices have less effect on changes in the Consumer Price Index.
Weight structure of the Harmonised Index of Consumer prices was also updated
Statistics Finland has also updated the weight structure of the Harmonised Index of Consumer Prices calculated for Eurostat, the Statistical Office of the European Communities. Its base year is the same as that of the national Consumer Price Index, 2015=100.
The Harmonised Indices of Consumer Prices are primarily used in price comparisons between the EU countries. The European Central Bank uses the Harmonised Index of Consumer Prices as the measure of inflation in its monetary policy.
The Finnish Harmonised Index of Consumer Prices is mainly based on the same weight and price data as the Finnish national Consumer Price Index, but its commodity selection is narrower. It does not include owner-occupancy, games of chance, interests and tax-like payments. The Harmonised Index of Consumer Prices covers 85 per cent of the national Consumer Price Index.
Table 1. Consumption items removed from the Harmonised Index of Consumer Prices and their weights in the Consumer Price Index 2015=100 in 2018
| COICOP code | Commodity/group | Weight in the CPI, o/o |
| 04.6 | Owner-occupied housing | 10.81 |
| 07.2.4.2.1.1 | Vehicle tax | 1.29 |
| 09.4.3 | Games of chance | 1.96 |
| 12.5.2.0.1.2 | Premium for fire insurance on detached houses | 0.10 |
| 12.6.2.1.1.2 | Interests on consumer credits | 0.88 |
| 12.7.0.1.1.2 | Other licences | 0.04 |
| Items removed from HICP, total | 15.09 | |
Source: Consumer Price Index, Statistics Finland
Inquiries: Kristiina Nieminen 029 551 2957, Satu Montonen 029 551 3205, khi@stat.fi
Director in charge: Ville Vertanen
Updated 19.2.2018
Official Statistics of Finland (OSF):
Consumer price index [e-publication].
ISSN=1799-0254. January 2018,
Weight structure and commodity basket of the Consumer Price Index are updated for the year 2018
. Helsinki: Statistics Finland [referred: 20.4.2025].
Access method: http://stat.fi/til/khi/2018/01/khi_2018_01_2018-02-19_kat_001_en.html

