Published: 12 February 2015
Reporting starts for the Kyoto Protocol's second commitment period
The Kyoto Protocol's second commitment period, 2013 to 2020, has started. Under the Protocol, the EU has a shared reduction commitment of 20 per cent in comparison with the emissions in 1990. According to the preliminary data published by Statistics Finland, Finland’s total emissions of greenhouse gases in 2013 corresponded with 63.2 million tonnes of carbon dioxide. Emissions grew by approximately one per cent compared with the previous year and were 12 per cent lower than in 1990. The whole time series of greenhouse gas emissions for the years 1990 to 2013 has been updated to correspond to the changed reporting requirements. Statistics Finland will publish revised emissions data on 15 April 2015.
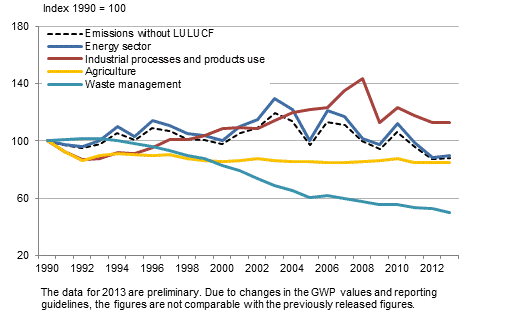
Development of greenhouse gas emissions by sector in Finland in comparison with the 1990 level

During the Kyoto Protocol's second commitment period (2013 to 2020), the calculation of emissions and commitments has changed due to the revised, internationally agreed methodological and reporting guidelines for greenhouse gas emissions. Compared with the Kyoto Protocol’s first commitment period (2008 to 2012), Finland’s emissions level has risen by one to four per cent, depending on the year. The emissions level is influenced, for example, by the revised GWP values (global warming potential) used in commensurating greenhouse gases, the allocation of emissions and the methodological changes made.
Total emissions increased by approximately one per cent; emissions in the energy sector rose by two per cent, emissions from industrial processes and products use and agriculture remained on level with the previous year, and emissions in the waste sector decreased by five per cent. In the energy sector, the use of coal increased, while the consumption of peat, oil and natural gas diminished.
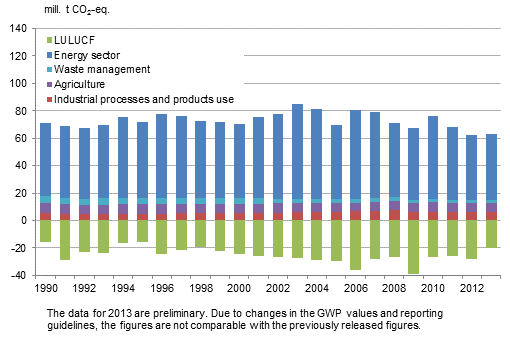
Compared with the previous year, removals in the Land Use, Land-Use Change and Forestry sector (LULUCF) decreased by approximately 27 per cent, to 20 million tonnes of carbon dioxide. This sector is not included in total emissions.
Greenhouse gas emissions and removals in Finland by sector

Greenhouse gas emissions in Finland by sector. Emissions as amounts corresponding to million tonnes of CO2. Negative figures are removals of greenhouse gases
| 1990 | 1995 | 2000 | 2005 | 2008 | 2009 | 2010 | 2011 | 2012 | 2013* | |
| Emissions without LULUCF¹ sector | 71.6 | 72.0 | 70.1 | 69.6 | 71.3 | 67.6 | 75.9 | 68.3 | 62.5 | 63.2 |
| Energy sector | 53.7 | 55.5 | 53.8 | 53.7 | 54.4 | 52.4 | 60.1 | 53.0 | 47.5 | 48.4 |
| Energy industries | 19.1 | 24.1 | 22.1 | 21.9 | 24.2 | 25.3 | 30.6 | 24.7 | 20.7 | 22.0 |
|
Manufacturing industries and construction |
13.7 | 12.4 | 12.3 | 11.7 | 11.1 | 8.7 | 10.2 | 9.9 | 8.7 | 8.7 |
| Transport | 12.1 | 11.4 | 12.2 | 13.0 | 12.9 | 12.3 | 12.8 | 12.6 | 12.2 | 12.1 |
| Other energy ² | 8.8 | 7.6 | 7.3 | 7.1 | 6.2 | 6.1 | 6.5 | 5.7 | 6.0 | 5.6 |
| Industrial processes and products use |
5.3 | 4.8 | 5.7 | 6.4 | 7.6 | 6.0 | 6.5 | 6.2 | 5.9 | 6.0 |
|
Industrial processes (excl. F-gases ³) |
5.2 | 4.8 | 5.1 | 5.5 | 6.2 | 4.5 | 4.7 | 4.6 | 4.4 | 4.4 |
|
Consumption of F-gases ³ |
0.1 | 0.1 | 0.6 | 0.9 | 1.4 | 1.5 | 1.8 | 1.6 | 1.5 | 1.6 |
| Agriculture | 7.6 | 6.9 | 6.6 | 6.5 | 6.5 | 6.6 | 6.7 | 6.5 | 6.5 | 6.5 |
| Waste | 4.7 | 4.6 | 3.9 | 2.8 | 2.7 | 2.6 | 2.6 | 2.5 | 2.5 | 2.3 |
| Indirect CO2 emissions |
0.3 | 0.2 | 0.2 | 0.1 | 0.1 | 0.1 | 0.1 | 0.1 | 0.1 | 0.1 |
| LULUCF¹ sector | -15.8 | -15.5 | -24.5 | -29.7 | -26.9 | -39.4 | -26.7 | -26.2 | -27.9 | -20.4 |
| ¹ LULUCF refers to the land use,
land-use change and forestry sector ² Other energy includes sub-categories heating of buildings, other fuel use in agriculture, forestry and fisheries, working machines in the sector, other fuel use and fugitive emissions from fuels ³ F-gases refer to fluorinated greenhouse gases (HFC, PFC compounds, SF6 and NF3) * Preliminary data. Due to changes in the GWP values and reporting guidelines, the figures are not comparable with the previously released figures. |
||||||||||
Monitoring of Finland’s emissions reduction commitments
The EU’s shared emissions reduction commitment under the Kyoto Protocol is divided into emissions within and outside the emissions trading sector. It is based on the regulations according to the EU's Climate and Energy Package. The reduction commitments of emissions trading are determined according to the Emission Trading Act. Based on the emission data reported to the Emissions trading registry, the Commission monitors the fulfilment of the reduction targets.
The Member States are responsible for reducing the emissions outside the emissions trading scheme and that is based on the commitments agreed in the EU’s effort sharing decision . Finland is committed to reducing non-emissions trading scheme emissions by 16 per cent by the year 2020. Between 2013 and 2020, emissions have to be on the so-called target path or lower. The path is linear and its starting point is the average of emissions from non-emissions trading scheme sources in 2008 to 2010 and its final point is the target for emissions reduction by 2020. The target path was confirmed based on the inventory submission in 2012. The expansion of the emissions trading scheme in the period 2013 to 2020 was taken into consideration in the definition of the target path, but not the correction to the effect of the new reporting guidelines.
In 2013, emissions under the emissions trading scheme grew by nearly seven per cent compared to the previous year, partly because of the extension of emissions trading by new activities. The application area of emissions trading act was expanded at the start of the new emissions trading period because the concept of incineration plant now comprises incineration of fuel in all kinds of plants, not anymore only in electricity and heat production. In addition, totally new activities were included in the application area, such as production of nitrogen acid, and hydrogen and synthesis gases.
Emissions outside the emissions trading scheme (e.g. use of fuels in heating of buildings, transport excl. civil aviation, agriculture, waste management and consumption of F-gases) went down by nearly four per cent in 2013 compared with the year before. They were below the target set by the EU by approximately one per cent.
Greenhouse gas emissions and removals broken down between emissions trading scheme sources and non-emissions trading scheme sources in 2005 and in 2008 to 2013 (million tonnes CO2 eq.)
| 2005 | 2008 | 2009 | 2010 | 2011 | 2012 | 2013* | Change, 2012-2013 | |
| Total excl. LULUCF sector | 69.6 | 71.3 | 67.6 | 75.9 | 68.3 | 62.5 | 63.2 | 0.7 |
| Emissions trading scheme emissions ¹ | 33.1 | 36.2 | 34.4 | 41.3 | 35.1 | 29.5 | 31.5 | 2.0 |
| Non-emissions trading scheme emissions ² | 36.5 | 35.2 | 33.2 | 34.6 | 33.2 | 33.0 | 31.7 | -1.3 |
| Non-emissions trading scheme emissions excluding CO2 emission from domestic civil aviation | 36.2 | 34.9 | 33.0 | 34.4 | 32.9 | 32.8 | 31.5 | -1.2 |
| LULUCF sector ³ | -29.7 | -26.9 | -39.4 | -26.7 | -26.2 | -27.9 | -20.4 | 7.5 |
| ¹ Source: Energy Authority. In
2013, emissions trading was expanded with new sectors ² Also includes the emissions of domestic civil aviation, although the emissions in question are in the emissions trading scheme of the EU's internal civil aviation ³ The land use, land-use change and forestry (LULUCF) sector does not come under the scope of the emissions trading scheme or the reduction targets under the effort sharing decision * Preliminary data. Due to changes in the GWP values and reporting guidelines, the figures are not comparable with the previously released figures |
||||||||
Kyoto Protocol, Articles 3.3 and 3.4
Emissions and removals according to paragraphs 3 and 4 of the Article 3 of the Kyoto Protocol have an effect on the fulfilment of the commitment. The emissions and removals from activities under Article 3.3 (afforstation, reforestation and deforestation) and from forest management under Article 3.4 must be reported during the second commitment period of the Kyoto Protocol. Finland chooses not to report on the alternative measures according to Article 3.4 (cropland management, grazing land management, revegetation or wetland drainage and rewetting) in the Kyoto Protocol’s second commitment period.
In 2013, afforestation and reforestation were a small net sink (-0.5 million tonnes CO2 eq.), deforestation a source of net emissions (2.8 million tonnes CO2 eq.), and forestry a significant net sink (-46.1 million tonnes CO2 eq.).
International emissions reporting in 2015
In addition to the annual emissions reporting to the EU and the UNFCCC and the Kyoto Protocol supplementing it, Finland must submit a report to the UNFCCC Secretariat by 15 April 2015, on the basis of which the assigned amount is calculated for the Kyoto Protocol’s second commitment period. The content of reporting the assigned amount will be described in connection with the next release of the Greenhouse Gas Inventory.
Emissions reporting is made yearly to both the European Union (preliminary data on 15 January and final data on 15 March) and the UN (on 15 April). This is made using the reporting software developed by the UNFCCC Secretariat. The software was renewed last year and its functioning has had serious defects. For this reason, the reporting schedule for the UNFCCC and the European Commission has been postponed. The duration of this postponement is not yet known. This postponement may have an effect on the reporting time of the assigned amount of emissions and the schedules and contents of Statistics Finland’s releases.
Source: Greenhouse gas inventory unit, Statistics Finland
Inquiries: Pia Forsell 029 551 2937, Riitta Pipatti 029 551 3543, kasvihuonekaasut@stat.fi
Director in charge: Leena Storgårds
Publication in pdf-format (220.2 kB)
- Tables
-
Tables in databases
Pick the data you need into tables, view the data as graphs, or download the data for your use.
- Revisions in these statistics
-
- Revisions in these statistics (12.2.2015)
Updated 12.2.2015
Official Statistics of Finland (OSF):
Greenhouse gases [e-publication].
ISSN=1797-6065. 2013. Helsinki: Statistics Finland [referred: 20.4.2025].
Access method: http://stat.fi/til/khki/2013/khki_2013_2015-02-12_tie_001_en.html

