Published: 24 October 2017
Share of employment and value added of cultural fields in the national economy remained on level with the previous year in 2015
In 2015, the share of culture in the economy was the same as in the year before, or 2.9 per cent of gross domestic product. In previous years, the tendency has been falling both in production and especially in employment, but this fall appears to have halted now at least for the time being. Although the share of culture in the economy is otherwise unchanged, the games industry grew strongly in 2015 as well. Most of the activity of the games industry remains outside the limitations of the actual culture satellite, but separate calculations have been made on the games industry for this release.
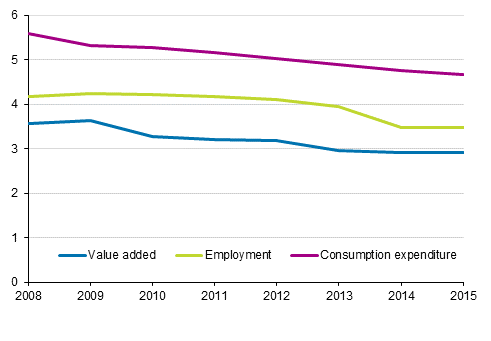
Percentage share of cultural industries in the national economy in 2008 to 2015

Measured in current prices, the value added of culture was in 2015 slightly higher than in 2014, but the share of culture in the value added of the whole economy was on the same level, because the value added of the entire economy also grew. In many industry groups, value added was either unchanged or had grown slightly and somewhat bigger growth was visible particularly in the industry groups ‘motion pictures, videos and computer games’ and ‘amusement parks, games and other entertainment and recreation’. On the other hand, industry groups related to newspapers and journals and periodicals and other printing went down clearly.
In 2015, the share of combined consumption expenditure of culture in all consumption expenditure fell slightly. The situation was similar for both private and public consumption expenditure, the amount of money in current prices used on culture remained in practice unchanged, whereas consumption expenditure grew on the level of entire culture, so the share of culture in both private and public consumption expenditure diminished.
In 2015, the share of culture in employment was 3.5 per cent. The share of culture in employment is clearly higher than its share of value added (2.9 per cent) or output (3.0 per cent). The labour domination of culture is affected by the relatively low pay level, part-time work and absence of large companies producing large profits. The absolute decrease in the number of employed persons in cultural industries that has continued since 2008 appears to have halted, and the number of employed persons was in 2015 the same as in 2014. However, there is no similar rise for 2015 visible in these figures as in Statistics Finland’s previously published statistics describing employment in cultural industries.
Cultural activities have conventionally been regarded as an activity that balances economic cycles, whose role usually grows somewhat during a downturn, because they include several permanent elements. The share of non-profit and public activities is significant and most engaged in the cultural field do not even imagine they will get rich by their activity. Culture is produced for its own sake in bad economic times as well, even without profit. The prolonged economic downturn has, however, been visible in both cultural production and in its consumption; for culture, people look for more inexpensive alternatives when the economy is tight, the rise of the economy is not actually visible in culture yet, although particularly in production it would appear that the long lasting fall has ended.
Despite the downturn, culture still has a fairly important role in the national economy, because its share of consumption is nevertheless nearly five per cent and its share of employed 3.5 per cent.
The games industry is growing fast and remains mostly outside the culture satellite.
Beside the culture satellite, Statistics Finland has also calculated total development between 2008 and 2015 for the games industry that has received much publicity. The games industry can, at least broadly understood, seen to belong to culture, but most game developer companies are working in the industry of programming, which is not included in the culture satellite calculations. The strong growth in the games industry that started in 2013 continued in 2015, though mainly through a few individual enterprises.
If games industry enterprises belonged to the culture satellite, the value added of culture in 2015 would be nearly 20 per cent higher than with the present limitation, and the GDP share of culture would also grow slightly from the previous year. Games industry enterprises would not have a significant effect on employment in the cultural industries, but employment would in practice remain at the same level. However, for the entire economy, the games industry does not at least yet have a huge significance, although its share of GDP has nearly tripled from around 0.2 to 0.6 per cent.
The statistics on Culture Satellite Accounts depict the economic significance of culture, using the concepts and methods of National Accounts. Data according to the Standard Industrial Classification TOL 2008 have now been released for the years 2008 to 2015 in accordance with the ESA2010 system.
The data for the Culture Satellite Accounts are published on the statistics website as database tables.
Source: Culture Satellite Accounts, Statistics Finland
Inquiries: Katri Soinne 029 551 2778, kansantalous@stat.fi
Director in charge: Ville Vertanen
Publication in pdf-format (212.1 kB)
- Tables
-
Tables in databases
Pick the data you need into tables, view the data as graphs, or download the data for your use.
Appendix tables
Updated 24.10.2017
Statistics:
Culture satellite accounts [e-publication].
ISSN=2323-9905. 2015. Helsinki: Statistics Finland [referred: 19.4.2025].
Access method: http://stat.fi/til/klts/2015/klts_2015_2017-10-24_tie_001_en.html

