Published: 11 August 2005
GDP fell in June
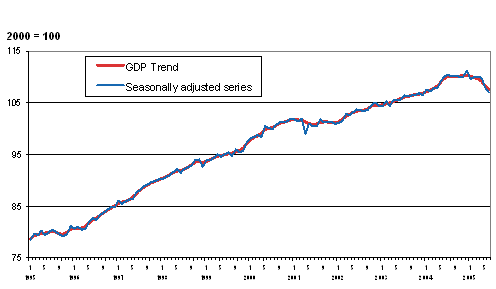
The industrial dispute that continued in the paper industry in June was reflected in figures on GDP. According to the seasonally adjusted series of the Monthly Indicator of GDP calculated by Statistics Finland, the volume of GDP fell by 0.8 per cent in June from the previous month. The trend of GDP indicates a decline of 0,7 per cent for the economy.
Volume of GDP in 1995 - 2005, trend and seasonally adjusted series

The series of the Monthly Indicator of GDP are seasonally adjusted with the Tramo/Seats method. The latest observations of the series adjusted for seasonal and random variation (seasonally adjusted and trend series) become revised with new observations in seasonal adjustment methods.
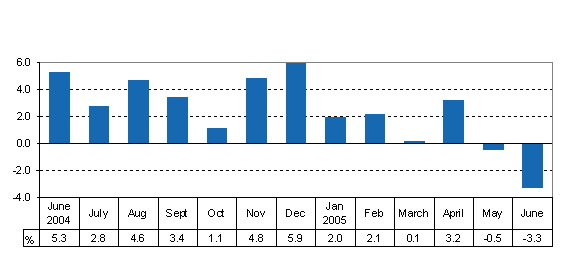
GDP fell by 3.3 per cent from June 2004
The volume of GDP fell by 3.3 per cent in June 2005 compared with last year's June. Among the main industries, output declined in manufacturing, transport and primary production.
Percentage changes of GDP from the previous year's corresponding month

According to the original series, industrial output fell by 11.5 per cent from June 2004. Output declined by 70 per cent in the wood and paper industry and by 33 per cent in energy supply. The output volumes of the whole metal industry were on level with the previous June while production in its sub-industry of manufacture of electrical and electronic equipment fell by one per cent. Output in other manufacturing contracted by 5 per cent.
Sales volumes of trade went up by 6 per cent. Motor vehicle sales grew by 12 per cent, wholesale trade by 3 per cent and retail trade by 6 per cent.
The volume of primary production fell by 30 per cent from the June 2004 level. Fellings decreased by 60 per cent and meat production by one per cent. Milk production remained on level with June of the year before.
Transport decreased by 9 per cent. Output was up by 2 per cent on June 2004 in both other service industries and in construction.
The Monthly Indicator of GDP is based on twelve monthly series on different industries of the economy. The series are summed up by weighting. The purpose of the Monthly Indicator is to anticipate the development of the quarterly gross domestic product calculated later with more detailed data.
GDP fell slightly in the second quarter from the quarter before
The industrial dispute in the paper industry that coincided with the second quarter of the year was reflected in figures on GDP. Estimates indicate that adjusted for seasonal variation and calendar days (working and trading days) the volume of GDP for the second quarter of 2005 was 0.4 per cent down on the corresponding quarter of the year before. Examined against original figures on output volumes, the decline from the same quarter twelve months back was 0.2 per cent. Preliminary data indicate that seasonally adjusted GDP fell by 1.2 per cent from the previous quarter.
Quarterly national accounts with more precise data on GDP will be published on 8 September 2005. The next Flash Estimate of GDP on Quarter will be published on 15 November 2005.
Source: Monthly Indicator of GDP 2005, June. Statistics Finland
Inquiries: Mr. Veli-Pekka Karvinen +358 9 1734 2667, kansantalous.suhdanteet@stat.fi
- Tables
-
Tables in databases
Pick the data you need into tables, view the data as graphs, or download the data for your use.
Last updated 11.8.2005
Official Statistics of Finland (OSF):
Trend Indicator of Output [e-publication].
ISSN=1798-5439. June 2005. Helsinki: Statistics Finland [referred: 19.4.2025].
Access method: http://stat.fi/til/ktkk/2005/06/ktkk_2005_06_2005-08-11_tie_001_en.html

