Published: 19 December 2007
Own-account worker households' consumption has grown most in 2001-2006
The consumption expenditure of both farmers and other own-account worker households grew most during 2001-2006, by over one-fifth (22 per cent), while the average growth in households' consumption expenditure was 14 per cent. These data derive from Statistics Finland's 2006 Household Budget Survey, for which data were collected from households in January-February 2006. Roughly 4,000 households participated in the survey.
Many recent studies and statistics have indicated that inequality has increased in Finland. A comparison of households' consumption expenditure in 2001 and 2006 introduces another viewpoint into the discussion, because the results of the Household Budget Survey indicate that consumption expenditure has grown unevenly across different population groups.
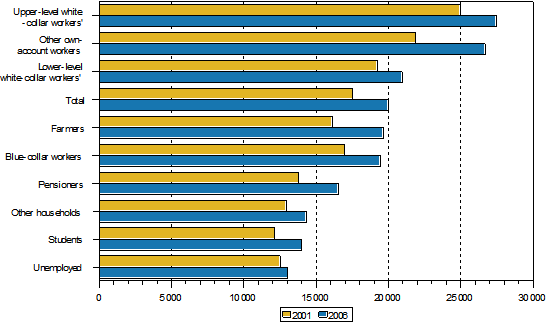
On the basis of changes that have taken place in 2001-2006, households can be classified into three groups at different levels of consumption. In 2006 the households of upper-level white-collar workers and other own-account workers than farmers belonged to the group with a high consumption level. In 2001 the consumption expenditure of the households of upper-level white-collar workers was clearly higher than that of other households, but according to the 2006 results, own-account worker households have nearly reached the consumption level of the households of upper-level white-collar workers (Figure 1). Own-account worker households' consumption grew more than average in all divisions of consumption apart from transport and communication, on which these households had already previously used significant amounts of money (Table 1). Own-account worker households' consumption on culture and recreation grew especially clearly, by some 56 per cent, and the share of these expenditure items of total consumption expenditure rose from 9 to 12 per cent.
Figure 1. Consumption expenditure by reference person's socio-economic status in 2001 and 2006 (at 2006 prices, EUR/consumption unit)

The mid-level consumption group was made up more clearly than before of the households of lower-level white-collar and blue-collar workers. The consumption expenditure of blue-collar worker households grew as much as consumption expenditure on average (14 per cent), whereas for lower-level white-collar worker households the growth of consumption expenditure capped at 9 per cent. The consumption expenditure of lower-level white-collar workers was thus closer to that of blue-collar worker households in 2006 than in 2001. Blue-collar worker households spent more money on transport (30 per cent) than before, while the average household expenditure on transport grew by some 18 per cent. Farmer households also rose to the mid-level consumption group. In 2006 they spent more money especially on household appliances and furnishings, transport, and culture and recreation than in 2001.
The households of the unemployed and students consumed less than others. The relative consumption status of the households of the unemployed weakened clearly from before, because these households' consumption expenditure grew by only some 4 per cent during the reference period. Therefore also the differences grew between the households of the unemployed, who consume the least, and those of upper-level white-collar workers, who consume the most. It should also be noted that the households of the unemployed have saved in many other respects, but not in communication. Communication expenditure among the households of the unemployed grew by 53 per cent, while the average growth in communication expenditure was roughly 23 per cent. The relative consumption status of student households improved slightly during the reference period. The consumption expenditure of these households grew by roughly 15 per cent during the reference period and more money than before was used on household appliances and furnishings, clothing and footwear, and transport.
The relative consumption status of pensioners improved during 2001-2006; these households' consumption expenditure grew by one-fifth (20 per cent). Pensioner households significantly increased their spending on transport and communication. The increase in transport expenditure is probably due to the fact that a large number of working-age persons who used their own car for transport retired during the reference period. More pensioner households than before have Internet access, which explains the increase in spending on communication
Table 1. Consumption expenditure by reference person's socio-economic status and division in 2001 and 2006 (at 2006 prices, EUR/consumption unit)
| Kulutusmenot | Total | Farmers | Other own- account workers |
Upper-level white- collar workers |
Lower-level white-collar workers |
||||||
| 2001 | 2006 | 2001 | 2006 | 2001 | 2006 | 2001 | 2006 | 2001 | 2006 | ||
| Consumption expenditure, total |
17 525 | 19 975 | 16 112 | 19 645 | 21 899 | 26 672 | 24 948 | 27 456 | 19 220 | 20 935 | |
| Food and non- alcoholic beverages |
2 253 | 2 485 | 2 707 | 2 667 | 2 611 | 2 936 | 2 539 | 2 799 | 2 264 | 2 513 | |
| Alcoholic beverages and tobacco |
447 | 495 | 261 | 226 | 488 | 614 | 558 | 579 | 451 | 551 | |
| Clothing and footwear |
525 | 716 | 385 | 569 | 718 | 977 | 966 | 1 412 | 679 | 856 | |
| Housing and energy |
5 298 | 5 654 | 5 087 | 6 282 | 6 311 | 6 990 | 6 094 | 6 231 | 5 391 | 5 331 | |
| Household furnishings, appliances and equipment |
842 | 980 | 796 | 1 141 | 1 196 | 1 466 | 1 331 | 1 520 | 911 | 1 043 | |
| Health | 696 | 734 | 494 | 447 | 727 | 872 | 693 | 695 | 596 | 624 | |
| Transport | 2 541 | 3 006 | 2 489 | 3 202 | 3 743 | 4 355 | 4 774 | 4 760 | 3 037 | 3 366 | |
| Communication | 459 | 564 | 516 | 612 | 589 | 657 | 551 | 650 | 539 | 617 | |
| Culture and recreation |
1 699 | 2 188 | 1 526 | 2 112 | 2 070 | 3 234 | 2 774 | 3 489 | 1 901 | 2 239 | |
| Hotels, cafés and restaurants |
871 | 846 | 394 | 430 | 1 004 | 1 237 | 1 504 | 1 722 | 1 153 | 1 035 | |
| Other expenditure | 1 895 | 2 306 | 1 456 | 1 955 | 2 444 | 3 335 | 3 163 | 3 599 | 2 299 | 2 759 | |
| Households in population |
2 381 500 | 2 455 000 | 51 032 | 44 060 | 138 336 | 144 379 | 381 417 | 409 653 | 385 549 | 394 313 | |
| Consumption units in household |
1,5 | 1,5 | 2,1 | 2,1 | 1,8 | 1,8 | 1,7 | 1,7 | 1,5 | 1,6 | |
| Kulutusmenot | Blue-collar workers |
Students | Pensioners | Unemployed | Others | ||||||
| 2001 | 2006 | 2001 | 2006 | 2001 | 2006 | 2001 | 2006 | 2001 | 2006 | ||
| Consumption expenditure, total |
16 989 | 19 415 | 12 151 | 14 004 | 13 796 | 16 519 | 12 526 | 13 044 | 12 934 | 14 309 | |
| Food and non- alcoholic beverages |
2 265 | 2 456 | 1 449 | 1 493 | 2 128 | 2 402 | 1 955 | 2 113 | 2 058 | 2 243 | |
| Alcoholic beverages and tobacco |
538 | 582 | 325 | 415 | 293 | 336 | 706 | 747 | 422 | 375 | |
| Clothing and footwear |
502 | 645 | 399 | 548 | 253 | 369 | 248 | 182 | 356 | 603 | |
| Housing and energy |
4 664 | 4 917 | 3 915 | 4 049 | 5 467 | 6 070 | 4 356 | 4 626 | 4 023 | 4 759 | |
| Household furnishings, appliances and equipment |
756 | 904 | 449 | 595 | 646 | 732 | 533 | 510 | 439 | 643 | |
| Health | 470 | 516 | 324 | 358 | 1 032 | 1 072 | 367 | 320 | 605 | 332 | |
| Transport | 2 707 | 3 507 | 1 443 | 1 814 | 1 073 | 1 766 | 1 174 | 1 294 | 1 718 | 1 292 | |
| Communication | 508 | 606 | 473 | 494 | 303 | 437 | 403 | 618 | 496 | 641 | |
| Culture and recreation |
1 621 | 2 144 | 1 348 | 1 673 | 1 160 | 1 553 | 1 094 | 1 142 | 1 073 | 1 268 | |
| Hotels, cafés and restaurants |
999 | 861 | 931 | 1 022 | 311 | 264 | 728 | 311 | 514 | 864 | |
| Other expenditure | 1 958 | 2 277 | 1 095 | 1 544 | 1 131 | 1 518 | 962 | 1 181 | 1 231 | 1 290 | |
| Households in population |
503 155 | 471 370 | 82 264 | 83 610 | 689 472 | 747 769 | 119 913 | 112 975 | 30 362 | 46 873 | |
| Consumption units in household |
1,6 | 1,6 | 1,2 | 1,2 | 1,2 | 1,2 | 1,3 | 1,3 | 1,5 | 1,4 | |
Consumption structure changing towards recreation and culture
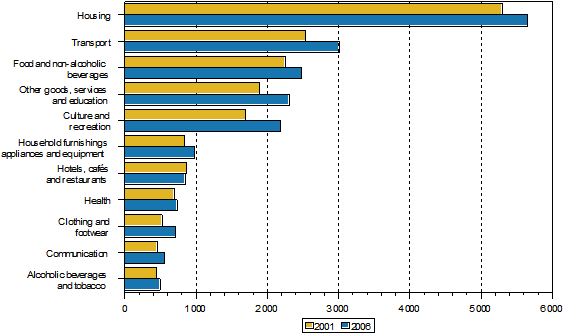
Changes in the proportions of the 12 consumption divisions of total consumption have been slight during the five-year period. The proportion of housing, which includes also the imputed profit for owner-occupiers when compared with a rented dwelling of the same standard, has fallen by 2 percentage points, even though more money than before has been used on housing. The proportion of money spent on food and on restaurant and hotel services also fell during 2006. The proportion of expenditure on culture and recreation has grown most, and growth was also observed in the groups of transport, clothing, and other goods and services.
Figure 2. Consumption expenditure by division in 2001 and 2006 (at 2006 prices, EUR/consumption unit)

Source: Household Budget Survey 2006, Statistics Finland
Inquiries: Mr Juha Nurmela +358 9 1734 2548, Mr Marko Ylitalo +358 9 1734 3560, kulutus.tilastokeskus@tilastokeskus.fi
Director in charge: Ms Riitta Harala
- Tables
-
Tables in databases
Pick the data you need into tables, view the data as graphs, or download the data for your use.
Last updated 16.1.2008
Official Statistics of Finland (OSF):
Households' consumption [e-publication].
ISSN=2323-3028. 2006. Helsinki: Statistics Finland [referred: 19.4.2025].
Access method: http://stat.fi/til/ktutk/2006/ktutk_2006_2007-12-19_tie_001_en.html

