Published: 17 June 2008
Food expenditure has increased by one-fifth in two decades
During the period 1985-2006 households' food expenditure increased in real terms by roughly one-fifth (21 per cent) per household. In 2006 households spent EUR 3,817 on food and non-alcoholic beverages, whereas in 1985 the corresponding expenditure at year 2006 prices was EUR 3,152 per household. Total consumption expenditure per household grew by 35 per cent over the same period. These data derive from Statistics Finland's Household Budget Survey's time series for 1985-2006. Households' consumption in different expenditure groups and by different background variables can be comprehensively examined with the help of the time series data in the database tables.
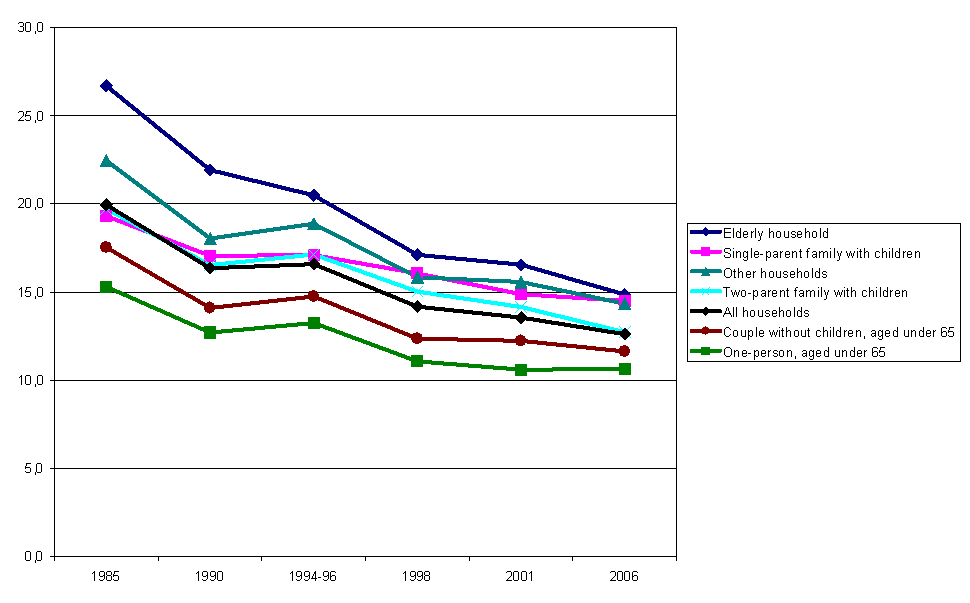
The share of food expenditure of households' total expenditure fell from 20 to some 13 per cent during the period 1985-2006 (Figure 1). As economic welfare has increased, the share of food expenditure of total expenditure has contracted. A comparison of different types of households shows that variation between the food expenditure shares of households with different structures also decreased notably during the reference period. While the share of food expenditure in elderly households was over one-fourth (27 per cent) in 1985, the corresponding share had fallen to 15 per cent in 2006. During the corresponding period the food expenditure of one-person households fell from 15 to 11 per cent. In addition to elderly households, also single-supporter households and the group other households use a higher than average share of their total expenditure on food. The group other households includes households with at least three adults and households with both working-age and retirement-age persons. The share of food expenditure is smaller than average in the households of couples without children and one-person households.
Figure 1. Share of expenditure spent on food (%) by type of household 1985, 1990, 1994-1996, 1998, 2001 and 2006

Even though the share of food expenditure of total expenditure has contracted, more money than before is spent on food and beverages. The biggest food expenditure items are made up of meat, bread, other cereal products as well as the group consisting of various dairy products, cheeses and eggs (Table 1). Together these make up over one-half of households' food expenditure. The share of meat products of households' average food expenditure contracted by four percentage points in the period 1985-2006 and stood at 18 per cent in 2006. Finnish households spent an average of EUR 698 on meat products in 2006, while in 1985 the corresponding expenditure at year 2006 prices was EUR 632 per household.
Households buy more processed foods, semi-finished foods and ready meal components than before. The trend in consumption of meat seems to run from fresh meat to seasoned or pre-processed meat. In stead of pork chops consumers prefer to barbeque pork meat with various seasonings. Is beef stroganoff, a favourite of the large age groups, being replaced by honey marinated chicken strips? The Household Budget Survey seems to indicate this; according to the data expenditure on poultry meat have grown many-fold since 1985.
Table 1. Structure of household food expenditure in 1985 and 2006 (%) and their change (percentage point) as well as real change in food expenditure 1985-2006 (1985=100)
| Food expenditure |
Structure and change | Real change | ||
| 1985 | 2006 | 1985-2006 | 1985-2006 | |
| % | % | (percentage point) | (1985=100) | |
| Food products and non-alcoholic beverages | 100 | 100 | 121 | |
| Bread and cereal products | 16 | 17 | 1 | 114 |
| Meat | 22 | 18 | -4 | 110 |
| Fish | 3 | 4 | 1 | 172 |
| Milk, cheese and eggs | 18 | 17 | -1 | 102 |
| Fats and oils | 6 | 2 | -4 | 66 |
| Fruit and berries | 7 | 7 | 0 | 108 |
| Vegetables, incl. potatoes | 7 | 10 | 3 | 170 |
| Sugar, jam, honey and sweets | 7 | 8 | 1 | 140 |
| Others food products | 4 | 8 | 4 | 252 |
| Non-alcoholic beverages | 9 | 8 | -1 | 115 |
Besides this decrease in expenditure on meat products, other clearly visible changes in food expenditure are the growth in the expenditure share of vegetables and the decrease in the expenditure share of fats and oils. Measured at 2006 prices, the consumption expenditure on fish products increased clearly, as did that on vegetables and potatoes. According to the two previous Household Budget Surveys, a Finnish household spent, on average, EUR 167 on fish products, whereas two decades previously the corresponding expenditure was in real terms EUR 97 per household. As with meat, households are choosing more and more semi-finished foods into their shopping basket in addition to fresh fish. Measured with consumption expenditure, the consumption of ready fish fillets as well as salted or smoked fish has increased markedly during the past couple of decades.
The Household Budget Survey's database tables include data on 1985, 1990, 1994-96, 1998, 2001 and the most recent data on 2006. The tables describe consumption expenditure at current prices, that is, prices are expressed at the values of the survey periods as well as at year 2006 prices in those expenditure groups for which conversion coefficients calculated in connection with National Accounts were available. Data on the number of households and disposable income are given at the end of the tables.
Source: Household Budget Survey 2006, Statistics Finland
Inquiries: Mr Marko Ylitalo +358 9 1734 3560 and Mr Juha Nurmela +358 9 1734 2548, kulutus.tilastokeskus@stat.fi
Director in charge: Ms Riitta Harala
- Tables
-
Tables in databases
Pick the data you need into tables, view the data as graphs, or download the data for your use.
Last updated 18.12.2008
Official Statistics of Finland (OSF):
Kotitalouksien kulutus [e-publication].
ISSN=1798-3533. 2006. Helsinki: Tilastokeskus [referred: 19.4.2025].
Access method: http://stat.fi/til/ktutk/2006/ktutk_2006_2008-06-17_tie_002_en.html

