Published: 30 December 2013
Consumption expenditure of student households decreased from 2006 to 2012
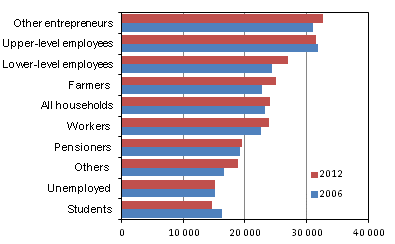
According to Statistics Finland's Household Budget Survey, households' consumption expenditure grew in real terms by 3.5 per cent per consumption unit 1) over the period 2006 to 2012 and was around EUR 24,000 in 2012. Among population groups, consumption of students diminished most. The consumption expenditure of unemployed persons and upper-level employees also decreased slightly compared with 2006. Among large population groups, consumption expenditure grew more than average in households of lower-level employees, workers and entrepreneurs. The real consumption expenditure of pensioner households went up by around two per cent. During 2012, a total of 3,551 households were interviewed for the Household Budget Survey.
Consumption expenditure by reference person’s socio-economic status in 2006 and 2012 (at 2012 prices, EUR/consumption unit)

In 2012, the amount of euros spent on consumption was biggest among households of entrepreneurs (excl. farmers) and upper-level employees, over EUR 30,000. In unemployed and student households, consumption expenditure amounted to approximately EUR 15,000. Consumption expenditure in households of lower-level employees, farmers and workers was in the middle consumption group. Pensioner households, already one third of all households, and the small group of other households 2) , are placed between the middle consumption group and the group of low consumption level.
Consumption main categories by reference persons socio-economic status in 2006 and 2012 (at 2012 prices, EUR/consumption unit), part 1
| All households | Farmers | Other self-employed persons | Upper-level employees | Lower-level employees | ||||||
| 2006 | 2012 | 2006 | 2012 | 2006 | 2012 | 2006 | 2012 | 2006 | 2012 | |
| Total consumption expenditure | 23 238 | 24 046 | 22 869 | 25 065 | 31 029 | 32 745 | 31 941 | 31 565 | 24 355 | 27 062 |
| Food and non-alcoholic beverages | 2 988 | 3 014 | 3 195 | 3 176 | 3 530 | 3 379 | 3 365 | 3 466 | 3 022 | 3 126 |
| Alcoholic beverages and tobacco | 635 | 564 | 292 | 492 | 788 | 762 | 743 | 548 | 707 | 566 |
| Clothing and footwear | 760 | 737 | 607 | 621 | 1 038 | 796 | 1 501 | 1 209 | 909 | 1 044 |
| Housing | 7 018 | 7 038 | 7 794 | 7 417 | 8 675 | 9 444 | 7 734 | 7 829 | 6 617 | 6 900 |
| Home furnishings, appliances and materials | 1 098 | 1 098 | 1 275 | 1 034 | 1 642 | 1 611 | 1 703 | 1 558 | 1 169 | 1 275 |
| Health | 797 | 808 | 478 | 483 | 946 | 913 | 754 | 771 | 677 | 737 |
| Transport | 3 400 | 3 950 | 3 636 | 4 072 | 4 927 | 6 257 | 5 384 | 6 145 | 3 808 | 4 521 |
| Communications | 500 | 592 | 542 | 620 | 582 | 768 | 576 | 664 | 546 | 671 |
| Culture and recreation | 2 177 | 2 458 | 2 111 | 3 004 | 3 217 | 3 400 | 3 471 | 3 287 | 2 228 | 3 234 |
| Hotels, cafés and restaurants | 1 039 | 1 004 | 531 | 656 | 1 520 | 1 488 | 2 116 | 1 775 | 1 272 | 1 423 |
| Other goods, services and training | 2 930 | 2 741 | 2 491 | 3 454 | 4 233 | 3 869 | 4 573 | 4 247 | 3 507 | 3 498 |
| Number of households in the sample | 4 007 | 3 551 | 132 | 100 | 237 | 222 | 774 | 687 | 686 | 652 |
| Number of households in the population | 2 455 000 | 2 594 999 | 43 806 | 33 994 | 144 378 | 145 838 | 409 652 | 444 004 | 394 312 | 435 440 |
| Average household size | 2,11 | 2,05 | 3,59 | 3,02 | 2,92 | 2,54 | 2,56 | 2,62 | 2,31 | 2,30 |
| Consumption units in household, average (oecdmod) | 1,49 | 1,47 | 2,13 | 1,90 | 1,82 | 1,68 | 1,67 | 1,69 | 1,57 | 1,57 |
Consumption main categories by reference persons socio-economic status in 2006 and 2012 (at 2012 prices, EUR/consumption unit), part 2
| Consumption expenditure | Workers | Students | Pensioners | Unemployed | Others | |||||
| 2006 | 2012 | 2006 | 2012 | 2006 | 2012 | 2006 | 2012 | 2006 | 2012 | |
| Total consumption expenditure | 22 586 | 23 858 | 16 292 | 14 625 | 19 218 | 19 538 | 15 175 | 15 109 | 16 646 | 18 920 |
| Food and non-alcoholic beverages | 2 953 | 3 026 | 1 795 | 1 806 | 2 889 | 2 884 | 2 541 | 2 140 | 2 697 | 2 920 |
| Alcoholic beverages and tobacco | 747 | 763 | 533 | 317 | 431 | 457 | 959 | 668 | 480 | 558 |
| Clothing and footwear | 685 | 668 | 582 | 729 | 392 | 423 | 193 | 188 | 641 | 924 |
| Housing | 6 102 | 6 296 | 5 025 | 4 554 | 7 534 | 7 079 | 5 742 | 6 034 | 5 906 | 6 016 |
| Home furnishings, appliances and materials | 1 012 | 1 071 | 666 | 557 | 820 | 823 | 571 | 591 | 720 | 997 |
| Health | 559 | 500 | 388 | 293 | 1 164 | 1 101 | 347 | 625 | 360 | 469 |
| Transport | 3 967 | 4 511 | 2 052 | 2 049 | 1 997 | 2 428 | 1 464 | 1 339 | 1 462 | 2 683 |
| Communications | 537 | 667 | 437 | 560 | 387 | 460 | 547 | 513 | 568 | 570 |
| Culture and recreation | 2 133 | 2 360 | 1 664 | 1 251 | 1 544 | 1 808 | 1 135 | 1 405 | 1 261 | 1 534 |
| Hotels, cafés and restaurants | 1 058 | 1 136 | 1 256 | 1 067 | 325 | 346 | 381 | 431 | 1 061 | 560 |
| Other goods, services and training | 2 894 | 2 835 | 1 960 | 1 353 | 1 929 | 1 709 | 1 500 | 1 157 | 1 637 | 1 637 |
| Number of households in the sample | 819 | 587 | 122 | 101 | 1 102 | 1 075 | 98 | 80 | 37 | 47 |
| Number of households in the population | 471 369 | 432 326 | 83 609 | 93 938 | 748 021 | 873 321 | 112 975 | 93 123 | 46 873 | 43 009 |
| Average household size | 2,48 | 2,35 | 1,56 | 1,55 | 1,44 | 1,46 | 1,67 | 1,58 | 1,92 | 2,45 |
| Consumption units in household, average (oecdmod) | 1,63 | 1,59 | 1,24 | 1,25 | 1,22 | 1,23 | 1,28 | 1,25 | 1,36 | 1,57 |
Transport and culture and recreation maintained growth of consumption
Households' expectations on consumption possibilities have an effect on their consumption. According to the balance figures of the Consumer Survey, expectations were still positive in 2012, but much more pessimistic than in 2006 (the balance figure 10.8 in 2006 and 5.2 in 2012). Quite evidently, consumption in 2012 was affected by the general uncertainty of the economic situation.
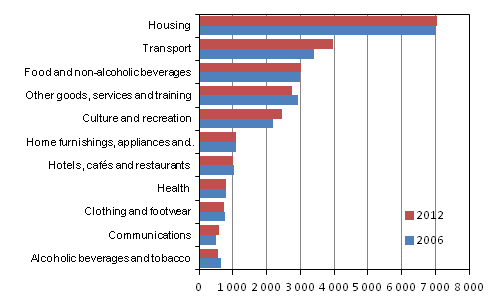
Despite this uncertainty, more money was used on transport and culture and recreation in 2012 than in 2006. The real growth of consumption expenditure was directed to these two categories in most socio-economic groups. Excluding unemployed households, more money was spent on communications than in 2006. The real consumption expenditure of housing and food remained on the level of 2006.
Consumption expenditure by main categories in 2006 and 2012 (at 2012 prices, EUR/consumption unit)

Part of the growth in transport expenses is caused by the formulation of the question on vehicle maintenance which was changed in 2012. The data on maintenance costs are more comprehensive than in 2006. The growth in consumption expenditure of telecommunications can be explained by the changeover to smart phones and the prevalence of fast Internet connections.
The prices of audiovisual and computer equipment, for example, declined considerably over the six-year period, thus the nominal amount of money used on culture and recreation decreased in several sub-groups. Of the sub-groups households spent more on toys and leisure equipment, pets, computer games and pay TV than in 2006. Whereas fewer books and magazines were bought in 2012 than in 2006.
The consumption expenditure of transport, telecommunications and culture and recreation also grew between 2001 and 2006, so it would seem that households' consumption preferences have been quite constant throughout the 2000s.
1) The consumption units are based on the so-called OECD's modified scale. The first adult in the household is one consumption unit. Other persons in the household aged at least 14 each are 0.5 consumption units and children aged 0 to 13 each are 0.3 consumption units. A household with one adult member is one consumption unit, while a household consisting of spouses and one child aged under 14 together are 1.8 consumption units. Consumption calculated by means of consumption units takes into account the size differences between households and enables their comparison with one another.
2) The group of other households includes households of reference persons who are home-makers or on unpaid sick leave.
Source: Households’ consumption 2012 . Statistics Finland
Inquiries: Juha Nurmela 09 1734 2548, Tarja Hatakka 09 1734 3553, kulutus.tilastokeskus@stat.fi
Director in charge: Riitta Harala
Publication in pdf-format (328.2 kB)
- Reviews
- Tables
-
Tables in databases
Pick the data you need into tables, view the data as graphs, or download the data for your use.
Updated 15.1.2014
Official Statistics of Finland (OSF):
Households' consumption [e-publication].
ISSN=2323-3028. 2012. Helsinki: Statistics Finland [referred: 19.4.2025].
Access method: http://stat.fi/til/ktutk/2012/ktutk_2012_2013-12-30_tie_001_en.html

