Published: 7 October 2014
Greenhouse gas emissions caused by households’ consumption have decreased
Total greenhouse gas emissions (GHG 1) ) caused by the average household's consumption decreased by ten per cent between 2006 and 2012. Emissions amounted to 20,500 kg of carbon dioxide equivalents in 2006 and to 18,500 kg in 2012. At the same time, total use of raw materials extracted from nature (RMC 2) ) grew by seven per cent from 25,400 kg to 27,000 kg.
The results were obtained by converting households' consumptions in euros in the 2006 and 2012 Household Budget Surveys into greenhouse gas emissions and into raw material consumption by means of the ENVIMAT model used by the Finnish Environment Institute. 3)
Households' greenhouse gas emissions (GHG) and raw material consumption (RMC) in 2006 and 2012
| Year | |||
| 2006 | 2012 | Year Change % 2006/2012 | |
| Households' GHG emissions, total, million tonnes CO2 eq. | 50,2 | 47,9 | -5 |
| Households' RMC, total, million tonnes | 62,3 | 70,3 | 13 |
| GHG emissions/household, kg CO2 eq. | 20 476 | 18 460 | -10 |
| RMC/household, kg | 25 363 | 27 084 | 7 |
| GHG/consumption unit, kg CO2 eq. 1) | 13 714 | 12 496 | -9 |
| RMC/consumption unit, kg | 16 990 | 18 381 | 8 |
Greenhouse gas emissions caused by combined consumption of households reduced from 50 to 48 million tonnes of CO2 eq. Over the same period, households' combined raw material consumption grew from 62.3 to 70.3 million tonnes.
The raw material intensity of consumption has risen. One explanation for this is that - contrary to what is commonly believed - the volume of goods consumption has risen faster in households' consumption than the volume of services.
According to national accounts, household consumption expenditure at constant prices grew in total by around nine per cent from 2006 to 2012. The consumption of services increased by eight per cent and that of goods by ten per cent. The consumption of several services, such as travel and restaurant services, involve much consumption of goods as well. The general intensity of consumption has grown, because the emission impacts of goods and material consumption are larger than those of services.
What are emissions and material consumption comprised of
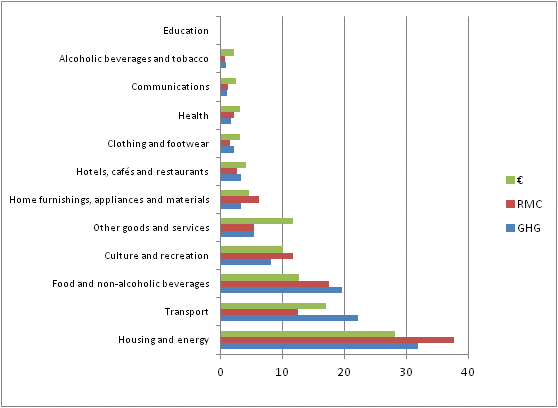
The emissions and material consumption of each consumption group are dependent on the euros spent, but the greenhouse gas and raw material intensities of different consumption groups vary considerably. The figure below shows a comparison of the distribution of euros spent on consumption and the percentages of emissions (GHG) and raw material consumption (RMC) caused by it by main consumption group.
Distribution of greenhouse gas emissions (GHG), raw material consumption (RMC) and euros (€) of the average household's consumption into main consumption groups as percentages in 2012

Housing causes most emissions and raw material consumption. Its share of emissions and raw material consumption is clearly higher than the share of euros spent for housing in consumption expenditure. The share of greenhouse gas emissions caused by transport is slightly higher than that of food, but its share of raw material consumption is clearly smaller than that of food. Culture and leisure consumption, and goods and services consumption have a clearly smaller share of emissions than their euro share is. For the group of other goods and services 4) , the RMC share is also lower than the euro share. See also the appendix table with data for the years 2006 and 2012.
Emissions and raw material consumption caused by households’ consumption are discussed in more detail in the web article of the Tieto&trendit periodical, where the Envimat model is described more closely (tietotrendit.stat.fi/mag/article/88/).
1) GHG = greenhouse gas emissions in the production and distribution chain of the product and in the consumption use of products. In addition to fossil carbon dioxide, includes methane, nitrous oxide and other greenhouse gases converted into carbon dioxide equivalents (CO2 eq.).
2) RMC = raw material consumption = how much raw materials from nature have been used for producing and distributing the products throughout the production and distribution chain.
3) https://helda.helsinki.fi/bitstream/handle/10138/38010/SY20_2009_Suomen_kansantalouden_materiaalivirtojen.pdf
4) The group of other goods and services includes such as insurance and various services and only a few goods.
Source: Households’ consumption 2012. Statistics Finland
Inquiries: Juha Nurmela 029 551 2548, kulutus.tilastokeskus@stat.fi
Director in charge: Riitta Harala
Publication in pdf-format (267.6 kB)
- Tables
-
Tables in databases
Pick the data you need into tables, view the data as graphs, or download the data for your use.
Appendix tables
Updated 7.10.2014
Official Statistics of Finland (OSF):
Households' consumption [e-publication].
ISSN=2323-3028. 2012. Helsinki: Statistics Finland [referred: 20.4.2025].
Access method: http://stat.fi/til/ktutk/2012/ktutk_2012_2014-10-07_tie_001_en.html

