Published: 28 December 2017
Consumption expenditure of persons aged over 64 growing
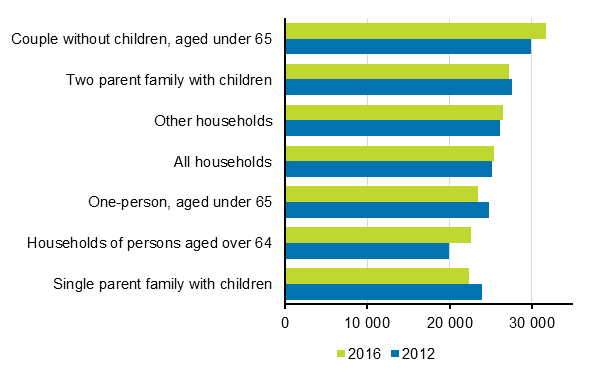
According to the preliminary data of Statistics Finland's Household Budget Survey, the consumption expenditure of households of persons aged over 64 grew most from 2012 to 2016, by nearly 14 per cent. This age group used more money than before, particularly on hotel and restaurant services, transport and telecommunications. However, their consumption expenditure was still lower than that of all other groups except for single-parent families, whose consumption decreased from four years ago and was more or less on the same level with pensioners in 2016.
Consumption expenditure by household type in 2012 and 2016 (at 2016 prices, EUR/consumption unit, average). The data concerning 2016 are preliminary.

The growth in consumption by households of persons aged 64 or over is connected to changes in the population structure. The significance of employment pensions as the income source of pensioners has grown at the same time as the number of national and guarantee pension recipients has decreased. This is visible in the rising income level of pensioner households and changes in the consumption structure.
Another group whose consumption grew from four years ago was that of childless couples aged under 65. Their consumption grew by around six per cent. Couples used more money on transport and hotel and restaurant services, for example.
The total consumption of other household groups has remained almost unchanged or diminished. The consumption expenditure of one-person households aged under 65 decreased clearly, by nearly six per cent. They spent less money than before particularly on culture and leisure. In 2016, nearly one quarter less was spent on leisure, or on the annual level around EUR 600 less than four years earlier.
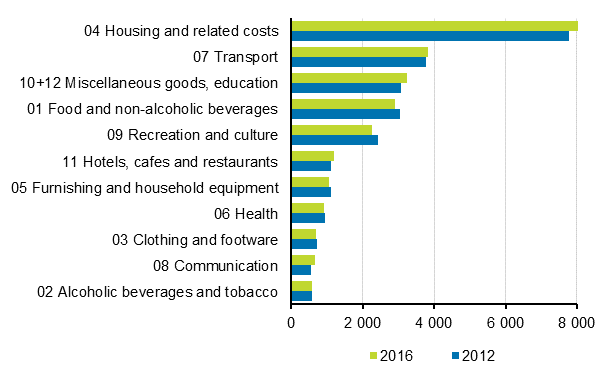
On the level of total population, money is used more than before on housing, telecommunications and hotels and restaurants, less on food, clothes, household supplies and culture and leisure. As concerns culture and leisure, it should be taken into account that the TV licence was abolished in 2013, when the public broadcasting tax took effect and the payment is no longer included in the statistics as households’ consumption.
Consumption expenditure by main group in 2012 and 2016 (at 2016 prices, EUR/consumption unit, average). The data concerning 2016 are preliminary.

Housing is clearly the biggest expenditure item for households. The share of expenditure in total consumption grew in four years by three percentage points, from 28 to 31 per cent. Transport takes the next biggest share of the purse, 15 per cent, and food about 11 per cent.
A total of 3,673 households were interviewed for the Household Budget Survey in the course of 2016. In the comparison with 2012, account has been taken of changes in monetary value and households’ age and size structure by calculating expenditure per consumption unit 1) . The final results of the Household Budget Survey and the time series from 1985 onwards supplemented with the data for 2016 and its database tables will be published in spring 2018 .
1) The consumption units are based on the so-called OECD's modified scale. One adult in the household is one consumption unit. Other persons in the household aged at least 14 each are 0.5 consumption units and children aged 0 to 13 each are 0.3 consumption units. A household with one adult is one consumption unit, while a household consisting of spouses and one child aged under 14 together are 1.8 consumption units. Consumption calculated by means of consumption units takes into account the size differences between households and enables their comparison with one another.
Source: Households' consumption 2016, Statistics Finland
Inquiries: Mira Kajantie 029 551 3626, Juha Nurmela 029 551 2548
Director in charge: Jari Tarkoma
Publication in pdf-format (177.7 kB)
- Tables
-
Tables in databases
Pick the data you need into tables, view the data as graphs, or download the data for your use.
Updated 28.12.2017
Official Statistics of Finland (OSF):
Households' consumption [e-publication].
ISSN=2323-3028. 2016. Helsinki: Statistics Finland [referred: 19.4.2025].
Access method: http://stat.fi/til/ktutk/2016/ktutk_2016_2017-12-28_tie_001_en.html

