Published: 9 July 2008
Two-way development in family farm incomes in the 2000s
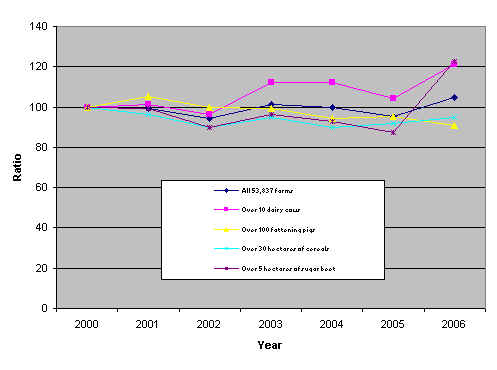
Milk producers’ taxable agricultural income per litre of milk has been clearly developing in the positive direction during this century, whereas fattening pig producers’ income per pig stand has been going downhill throughout the 2000s. Cereal producers’ taxable agricultural income per hectare of cereal also fell by five per cent from 2000 to 2006. Sugar beet producers’ income per hectare of beet declined up to 2005, but basing on the adjacent figure seems to have grown hugely in the last year of the examined time period. However, the reason for the apparent spurt of growth is that the cultivated area of sugar beet per holding diminished by approximately three hectares in 2006, in other words diminished divisor produced a larger quotient. What in fact happened was that in 2006 the income from the sales of sugar beet fell by around EUR 3,400 from the previous year per sugar beet farm, but risen agricultural subsidies and income from other produce not only compensated for the loss of income from sugar beet but actually increased taxable income. These data derive from the 2006 Statistics on the finances of agricultural and forestry enterprises published by Statistics Finland.
Total taxable income from agriculture of farming spouses by unit of principal production in 2000-2006 (2000=100)

The examination across production sectors has been completely
revised. The farms in the farm register where the holder of the
farming right and the person liable to pay taxes on agriculture was
a natural persons continuously from 2000 to 2006 were selected as
its targets. Over the examined time period the total number of such
agricultural enterprises was 53,837. Enterprises which met at least
one of the following criteria were selected from this population
for a closer analysis:
a) over the seven years, the farm had continuously more than 10
dairy cows
b) or continuously more than 100 fattening pigs
c) or continuously more than 30 hectares of cereals
d) or continuously more than five hectares of sugar beet.
There were 15,285 farms in Finland which met one of the set
conditions. The aim in the specifying of the selection criteria was
to have in the panel agricultural enterprises that provide
employment for at least one person, at least in respect of
livestock farms. In 2006, the arable land area of the cereal farms
selected to the panel was over 82 hectares, so in terms of arable
land area they were notably larger than the average. The average
size of the sugar beet farms was also nearly 60 hectares. This
selection procedure also eliminated impacts from changes of
production sector on the results.
Although for the producers of fattening pigs the result in agriculture has been diminishing in relative terms throughout the 2000s, in absolute terms the result of these enterprises was the highest of the compared production sectors in 2006, at nearly EUR 47,000 per enterprise. Dairy cattle farms produced the second highest result of EUR 41,400 while cereal farms produced the lowest result of EUR 26,000. Whereas a family running a fattening pig farm receives EUR 21,500 more than a cereal farm as wages and interest on own equity for rearing of 500 fattening pigs and cultivation of 78 field hectares, a cereal farmer receives EUR 26,000 for the cultivation of 82 hectares. The taxable value of the production capital of pig farms was more than double that of cereal farms, EUR 234,000 in 2006, and interest should also be earned on it. Against this background the crisis in fattening pig rearing becomes understandable, as wages from the rearing of pigs are modest. The dairy cattle farms in the panel had an average number of 25 milking cows in 2006, which also demands the work input of at least one person on every single day of the week. Nevertheless, both dairy and pig farm entrepreneurs have made investments and increased their production strongly in the 2000s. The number of cows has gone up by four per dairy farm and the number of fattening pigs by over one hundred per enterprise. Further information on the subject can be found in Chapter 5, ‘Changing theme’, of the review of these statistics.
The forestry section of these statistics describes now for the first time the income of all private forestry owners from roundwood sales, and expenditure incurred from forest cultivation and silviculture basing on the financial statements data of forest owners. The data are grouped by legal form of forest owner, region, and according to whether the forest owner is also liable to pay tax on agriculture. The persons liable for taxation on agriculture are divided into owners of active and passive holdings. Thus, the statistics now describe for the first time the result of so-called urban forest owners from forestry. Exclusive of the value of purchased services, private forest owners sold roundwood for a total value of EUR 1,026 million in 2006. Of this, active agricultural entrepreneurs accounted for EUR 334 million, owners of passive holdings for EUR 212 million and urban forest owners for EUR 481 million. Data on result by enterprise are presented in the section on forestry in this statistical review.
Source: Statistics on the finances of agricultural and forestry enterprises, Statistics Finland
Inquiries: Hannu Maliniemi (09) 1734 2796
Director in charge: Ari Tyrkkö
Updated 9.7.2008
Official Statistics of Finland (OSF):
Statistics on the finances of agricultural and forestry enterprises [e-publication].
ISSN=2489-320X. 2006. Helsinki: Statistics Finland [referred: 26.4.2025].
Access method: http://stat.fi/til/mmtal/2006/mmtal_2006_2008-07-09_tie_001_en.html

