Published: 27 April 2012
Immigration clearly up on the previous year
According to Statistics Finland, 29,500 persons immigrated to Finland from foreign countries during 2011. The number is 3,100 higher than in the previous year and the highest during Finland’s independence. Emigration from Finland also increased slightly and was 12,650 persons. During 2011, net immigration totalled 16,800 persons, which is 3,100 up on the year before. Net immigration by foreign citizens increased clearly, or by 2,000 persons.
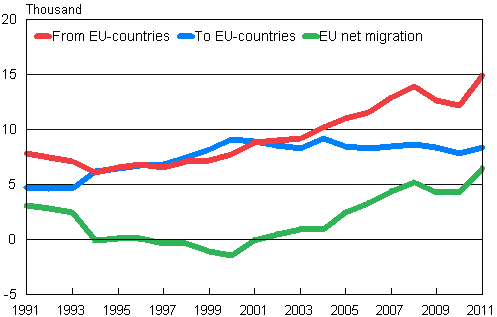
Migration between Finland and other EU countries 1991–2011

Last year, 14,900 persons immigrated to Finland from the EU countries. Immigration from the EU countries was 2,750 persons up on the year before. Emigration from Finland to the EU countries increased by 600 persons. Emigration from Finland to the EU countries grew slightly from the previous year. In 2011, Finland had a migration gain of 6,500 persons from the EU countries. Finland’s migration gain from the EU countries was clearly up on the previous year.
In 2011, intermunicipal migrations numbered 281,550, which is 10,850 more than in 2010. Migrations between regions numbered 126,550, having increased by 4,600. Migration inside regions increased by 6,250. In 2011, intramunicipal migrations numbered 594,150, which is 25,150 (4 %) up on 2010.
When looking at migration inside the country, the region of Uusimaa had the largest and the region of Pirkanmaa the second largest migration gain. In Uusimaa the gain amounted to 2,200 and in Pirkanmaa to 1,450 persons. Migration gain relative to the population was the largest in Pirkanmaa where it was three per mille. The regions having suffered the largest population loss in migration inside the country were Lapland and Kainuu where the migration loss was 700 persons. Kainuu had the largest relative migration loss of eight per mille. Relative migration loss was the second largest in Lapland. Twelve regions suffered migration loss in intramunicipal migration.
No region suffered migration loss in migration between Finland and foreign countries. The number of regions with migration loss drops clearly when net international migration is taken into consideration. The sum of net immigration and net emigration was negative in only six regions.
Internal migration and in- and out-migration 2000–2011
| Year 1) | Type | ||||
| Intermunicipal | Intramunicipal migration | Immigration | Emigration | Net migration | |
| 2000 | 243,034 | 544,690 | 16,895 | 14,311 | 2,584 |
| 2001 | 263,989 | 594,609 | 18,955 | 13,153 | 5,802 |
| 2002 | 256,382 | 577,888 | 18,113 | 12,891 | 5,222 |
| 2003 | 255,502 | 593,589 | 17,838 | 12,083 | 5,755 |
| 2004 | 265,157 | 599,494 | 20,333 | 13,656 | 6,677 |
| 2005 | 274,642 | 617,327 | 21,355 | 12,369 | 8,986 |
| 2006 | 272,280 | 593,286 | 22,451 | 12,107 | 10,344 |
| 2007 | 278,907 | 589,363 | 26,029 | 12,443 | 13,586 |
| 2008 | 268,524 | 561,549 | 29,114 | 13,657 | 15,457 |
| 2009 | 263,646 | 571,617 | 26,699 | 12,151 | 14,548 |
| 2010 | 270,688 | 568,997 | 25,636 | 11,905 | 13,731 |
| 2011 | 281,537 | 594,140 | 29,481 | 12,660 | 16,821 |
Source: Population and Cause of Death Statistics. Statistics Finland
Inquiries: Matti Saari 09 1734 3401, vaesto.tilasto@stat.fi
Director in charge: Jari Tarkoma
Publication in pdf-format (280.8 kB)
- Tables
-
Tables in databases
Pick the data you need into tables, view the data as graphs, or download the data for your use.
Appendix tables
- Figures
- Quality descriptions
-
- Quality description, migration 2010 (27.4.2012)
Updated 27.4.2012
Official Statistics of Finland (OSF):
Migration [e-publication].
ISSN=1797-6782. 2011. Helsinki: Statistics Finland [referred: 19.4.2025].
Access method: http://stat.fi/til/muutl/2011/muutl_2011_2012-04-27_tie_001_en.html

