Published: 9 December 2010
Gross domestic product grew by 0.5 per cent from the previous quarter and by 3.7 per cent year-on-year
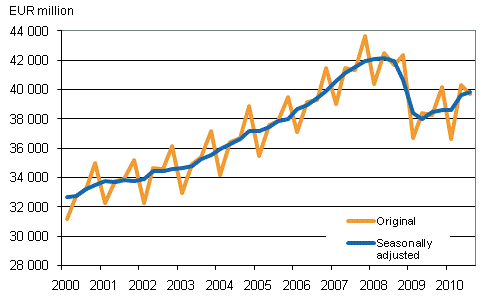
According to preliminary data of Statistics Finland, in the July to September period of 2010 the volume of Finland’s gross domestic product went up by 0.5 per cent from the previous quarter. Compared to the third quarter of 2009, working-day adjusted GDP grew by 3.7 per cent. The third quarter of 2010 had the same number of working days as twelve months before.
Gross domestic product by quarter at reference year 2000 prices

Revisions put the change in the volume of GDP in the second quarter of 2010 at +2.6 per cent from the previous quarter (was +1.9%) and at +4.9 per cent from twelve months back (from originally calculated +3.7%). The revisions were in particular caused by larger than anticipated accrual from taxes on products and upward revisions in the private services source data. The data of the seasonally adjusted and trend series always become revised as new observations become available. Revisions especially at turning points of economic trends may be significant, which should be taken into consideration when using seasonally adjusted and trend data.
The volume of exports remained on level with the previous quarter but grew by 9.4 per cent year-on-year. Imports increased by 5.5 per cent from the previous quarter and by 7.3 per cent year-on-year.
In the third quarter, the volume of private consumption grew by 0.9 per cent from the previous quarter and by 3.1 per cent from twelve months back. Investments went up by 2.7 per cent from the previous quarter and by 8.9 per cent year-on-year.
Volume refers to data adjusted for price changes. Volumes at reference year 2000 prices are expressed relative to the 2000 level at current prices (in EUR). Change percentages from the quarter of the previous year have been calculated from time series adjusted for working days, and change percentages from the previous quarter from seasonally adjusted time series.
In July 2010, Statistics Finland started to produce three new indicators derived from the quarterly sector accounts of national accounts: households' saving rate, non-financial corporations' investment rate and non-financial corporations' profit share. These time series can be viewed on Eurostat's website at: http://epp.eurostat.ec.europa.eu/portal/page/portal/sector_accounts/data/quarterly_data
Source: National Accounts 2010, 3rd quarter. Statistics Finland
Inquiries: Pasi Koikkalainen (09) 1734 3332, Samu Hakala (09) 1734 3756, Samu Hakala (09) 17343756, kansantalous.suhdanteet@stat.fi
Director in charge: Ari Tyrkkö
Publication in pdf-format (262.6 kB)
- Reviews
- Tables
-
Tables in databases
Pick the data you need into tables, view the data as graphs, or download the data for your use.
Appendix tables
Updated 9.12.2010
Official Statistics of Finland (OSF):
Quarterly national accounts [e-publication].
ISSN=1797-9765. 3rd quarter 2010. Helsinki: Statistics Finland [referred: 19.4.2025].
Access method: http://stat.fi/til/ntp/2010/03/ntp_2010_03_2010-12-09_tie_001_en.html

