Revisions of data are typical in quarterly accounts
The data in all time series of quarterly accounts may become revised either because of revisions in the source data or changes in calculation methods. In addition to this, the figures of seasonally adjusted and trend series become revised in each quarter even if no changes have taken place in the source data or calculation methods.
Quarterly accounts data for the fourth quarter of 2008 were released on 27 February 2009. Compared to the previous release of data on the third quarter made in December 2008, the data on the volume of gross domestic product (GDP) had in this release become revised as follows:
1. Year-on-year changes, i.e. changes from the same quarter of the previous year. These are calculated either from original series or series adjusted for working days.
In the December release, the year-on-year changes in the volume of GDP calculated from the original series were: 2008Q1 2.3%, 2008Q2 2.5 % and 2008Q3 1.3 %.
In the February release, the year-on-year changes in the volume of GDP calculated from the original series were: 2008Q1 2.4%, 2008Q2 2.5% and 2008Q3 1.5%.
Thus, the revisions in the year-on-year changes were quite minor: only the first and third quarter became revised slightly upwards. From this, we can conclude that no major changes took place in either the source data or the calculation methods.
2. Quarter-on-quarter changes i.e. changes from the previous quarter. These are calculated from seasonally adjusted time series.
In the December release, the quarter-on-quarter changes in the volume of GDP calculated from the seasonally adjusted series were: 2008Q1 0.2%, 2008Q2 0.5% and 2008Q3 0.1%.
In the February release, the quarter-on-quarter changes in the volume of GDP calculated from the seasonally adjusted series were: 2008Q1 -0.3%, 2008Q2 0.1% and 2008Q3 -0.3%.
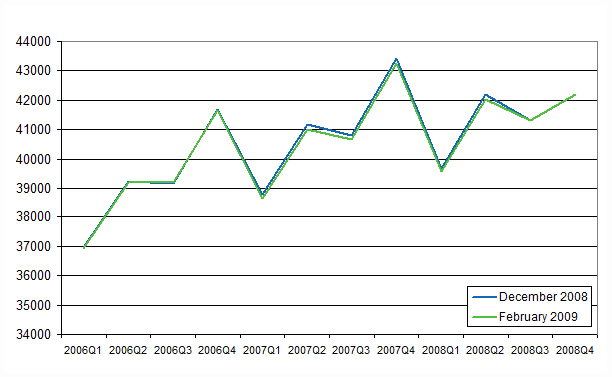
The percentages describing quarter-on-quarter changes show considerable revisions. Because the year-on-year changes calculated from the original series did not become revised, it is obvious that these revisions were due to seasonal adjustment. Seasonal adjustment methods (the TRAMO/SEATS method is used in quarterly accounts) are highly sensitive to the latest observation so the exceptionally low figure for the fourth quarter of 2008 also causes revisions to the seasonally adjusted figures on the quarters preceding it. Thus, even major revisions to seasonally adjusted and trend series are quite normal and are due to the nature of seasonal adjustment models. The steeper the turns up or downwards, the greater the revisions in the seasonally adjusted figures. This is clearly visible in Figure 1.
Figure 1: Seasonally adjusted volume of GDP, development in quarterly accounts releases 2008Q1-Q4

Figure 1 also shows that the GDP line runs slightly lower than those of previous releases already in 2007. This is because the data on 2007 had become slightly revised downwards in the GDP data released from annual accounts in January 2009. A level change like this lowers the data on all quarters of 2007 and 2008 in the seasonally unadjusted time series for February and also becomes transmitted to the seasonally adjusted series. In other words, the turn of the February GDP line, or angular coefficient, into a decline is solely caused by the 2008Q4 observation and its effect on the seasonal adjustment, but due to the revision of annual accounts the line also runs lower in February than in December.
The seasonally adjusted series for February shows that the seasonal adjustment method has revised the 2007Q4 observation upwards from December, although the level change has revised the entire time series downwards. The possible reason for this is that the new 2008Q4 observation for February was exceptionally low in the time series so that in a way the seasonal adjustment method changed its perception (coefficient) concerning the 2007Q4 observation upwards.
Figure 2: Volume of GDP, original time series

Figure 2 contains the original, i.e. seasonally unadjusted, GDP volume series. The figure also shows that apart from the level change between 2007 and 2008 caused by the revision of annual accounts no other significant change has taken place in the portrayal of trend in the February release. In the original series, too, 2007Q4 has descended quite as expected due to the level change of annual accounts, even though in the original series it ascended, perhaps somewhat surprisingly.
Indeed, economic development should not be monitored with seasonally adjusted figures only and this is precisely why quarterly accounts releases always also contain information about year-on-year change in GDP as calculated from series adjusted for working days.
Inquiries: Tuomas Rothovius +358 9 1734 3360, Pasi Koikkalainen +358 9 1734 3332, kansantalous.suhdanteet@stat.fi
Last updated 27.4.2009
Official Statistics of Finland (OSF):
Neljännesvuositilinpito [e-publication].
ISSN=1797-9749. Helsinki: Tilastokeskus [referred: 18.4.2025].
Access method: http://stat.fi/til/ntp/ntp_2009-04-08_uut_001_en.html

