Published: 20 March 2013
Faster completion of qualifications and degrees
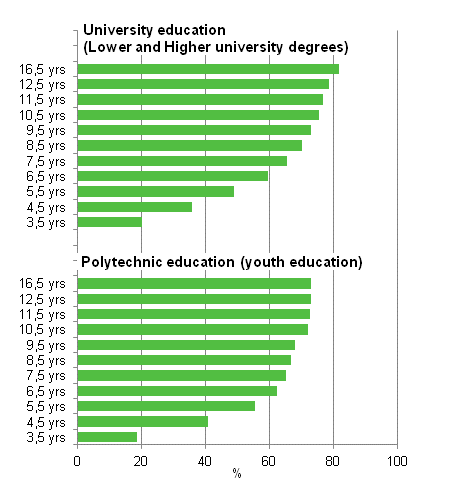
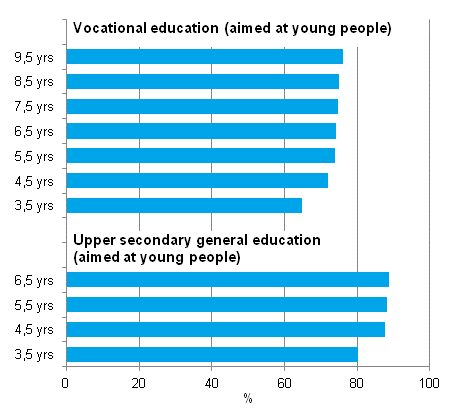
According to Statistics Finland, university education was completed by 49 per cent of students in about five-and-a-half years, a higher university degree by 21 per cent and a lower university degree by 28 per cent. The pass rate for university education improved by two percentage points. In other sectors of education, the pass rate improved by one percentage point. The pass rate for a polytechnic degree in four-and-a-half years was 41 per cent. Initial vocational education was passed in three-and-a-half years by 65 per cent, and matriculation examination by 80 per cent.
Pass rates for university and polytechnic education in different reference periods by the end of 2011

These statistics examine the situation at the end of 2011 of students having started vocational education or upper secondary general education aimed at young people in 2008, polytechnic education for young people in 2007, and university education in 2006.
Pass rates for vocational and upper secondary general education in different reference periods by the end of 2011

Women's pass rate in all sectors of education apart from general and vocational upper secondary education is still higher than that of men, even though men's pass rate has improved in all sectors of education. Men's pass rate in university education improved by over three percentage points and in upper secondary general education by nearly two percentage points. The pass rates of vocational education and polytechnic education improved by one percentage point. In upper secondary general education, men and women graduated nearly at the same rate. In initial vocational education, men's pass rates were two percentage points higher than that of women. The differences in pass rates between men and women were considerably bigger in tertiary level education. Thirty-seven per cent of men and 58 per cent of women attained a higher or lower university degree. A polytechnic degree was attained by 25 per cent of men and by 54 per cent of women.
At least three out of four complete the university degree they have started to study for. By the end of 2011, nearly 82 per cent of those who had started their university education 16 years earlier completed their degree and among those who had started polytechnic education in the same year, 73 per cent completed their polytechnic degree. In a 10 year examination period, initial vocational education was completed by 77 per cent and matriculation examination by nearly 89 per cent of those who had started the education in question.
In all sectors of education there are big field-specific differences in the pass rates (see Tables in databases ). Tertiary level degrees were completed at universities in relative terms the most by students in the field of culture and the least by students in the field of natural sciences. In polytechnic education the highest pass rate of 63 per cent was achieved in the field of health, welfare and sports. At 22 per cent, the pass rate was the lowest in the field of technology and transport. In vocational education nearly all had attained a qualification in the fields of safety and security (other education: fire fighter, police). The next highest pass rates were in the field of welfare, health and sports, in which a vocational qualification had been attained in the respective field by 68 per cent of students. The pass rate was the lowest in the field of natural sciences, at 47 per cent.
The tables in databases for these statistics include information on those students who did not attain their qualification in the target time. Information related to studying is also available from the statistics describing Discontinuation of education and Employment of students .
Source: Education Statistics, Statistics Finland
Inquiries: Anna Loukkola 09 1734 3678, koulutustilastot@stat.fi
Director in charge: Riitta Harala
Publication in pdf-format (251.5 kB)
- Tables
-
Tables in databases
Pick the data you need into tables, view the data as graphs, or download the data for your use.
Appendix tables
- Appendix table 1. Progress of new upper secondary school students (aimed at young people) studies by end 2011 (20.3.2013)
- Appendix table 2. Progress of new students studies in vocational education (aimed at young people) by end 2011 (20.3.2013)
- Appendix table 3. Progress of new polytechnic students studies by end 2011, youth education (20.3.2013)
- Appendix table 4. Progress of new university students studies by end 2011, lower or higher university degrees (20.3.2013)
Updated 20.3.2013
Official Statistics of Finland (OSF):
Progress of studies [e-publication].
ISSN=1799-1021. 2011. Helsinki: Statistics Finland [referred: 19.4.2025].
Access method: http://stat.fi/til/opku/2011/opku_2011_2013-03-20_tie_001_en.html

