Published: 20 March 2014
Polytechnic education was completed faster
Corrected on 24 March 2014. The correction is
indicated in red. Was previously 17 per cent.
According to Statistics Finland's Education Statistics for the year
2012, 80 per cent of upper secondary general school students
completed a qualification in at most three-and a-half years.
Sixty-four per cent of students attending vocational education
aimed at young people passed their qualifications within the same
time. Forty-three per cent of students attending polytechnic
education aimed at young people completed education in
four-and-a-half years. A lower or higher university degree in
university education was completed by 49 per cent of students in
five-and-a-half years.
Pass rates by sector of education in 2012 and 2011
| Sector of education | Duration of studies (years) | Pass rate 2012 (%) | Pass rate 2011 (%) | Difference between pass rates in 2012–2011 |
| Upper secondary general education aimed at young people | 3,5 | 79,5 | 80,3 | -0,8 |
| Vocational education aimed at young people | 3,5 | 64,3 | 64,9 | -0,6 |
| Polytechnic education (youth education) | 4,5 | 43,3 | 40,6 | 2,7 |
| University education (lower and higher university degrees) | 5,5 | 49,4 | 48,9 | 0,5 |
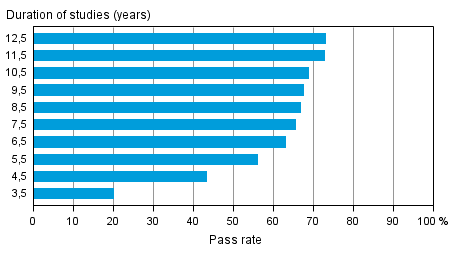
Pass rates for polytechnic education in different reference periods by the end of 2012

The share of passers of the polytechnic degree in those having started polytechnic education aimed at young people, that is, the pass rate of education, grows the longer time has passed from the start of education. Forty-three per cent of students completed their education in four-and-a-half years or faster. Education was completed in at most seven-and-a-half years by 65 per cent and in twelve-and-a-half years by 73 per cent of polytechnic students.
Pass rates of polytechnic education for young people in 2012 and 2011 by sex for those having studied for 4.5 to 5.5 years
| Sector of education | Duration of studies (years) | Gender | Pass rate 2012 (%) | Pass rate 2011 (%) | Difference between pass rates in 2012–2011 |
| Polytechnic education (youth education) | 4,5 | Men | 28,0 | 24,8 | 3,2 |
| Women | 55,8 | 54,1 | 1,7 | ||
| 5,5 | Men | 43,1 | 41,3 | 1,8 | |
| Women | 67,0 | 67,1 | - 0,1 |
Female students in polytechnic education completed their polytechnic degrees more often than men did. Twenty-eight per cent of men and 56 per cent of women passed their polytechnic degree in at most four-and-a-half years, and the difference between the pass rates was 28 percentage points. Fifty-five per cent of men and 74 per cent of women completed education in seven-and-a-half years, that is, the difference between the pass rates was 19 percentage points.
Compared to the situation in 2011, polytechnic degrees were completed in 2012 more often in four-and-a-half years or in five-and-a-half years. The share of those completing their qualification in four-and-a-half years grew for men by three percentage points and for women by nearly two percentage points.
One-half of new students in university education completed their degrees in at most five-and-a-half years
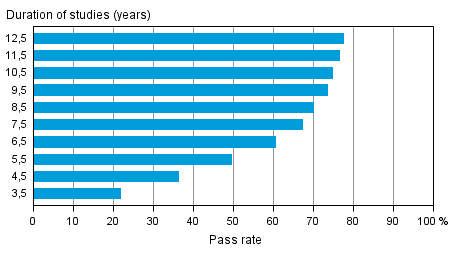
Forty-nine per cent of university students completed a higher or lower university degree in at most five-and-a-half years. The older the cohort of new students is examined, the higher the pass rate became: 67 per cent of students completed a higher or lower university degree in at most seven-and-a-half years and as many as 78 per cent of those having studied for 12.5 years had passed a higher or lower university degree.
Pass rates for university education in different reference periods by the end of 2012 (lower and higher university degrees)

As in polytechnic education, there were large differences between sexes in completing university education. Thirty-seven per cent of male students and 59 per cent of female students had completed a higher or lower university degree in five-and-a-half years. The difference between men's and women's pass rates was 22 percentage points.
A higher or lower university degree had been completed in at most seven-and-a-half years by 57 per cent of male students and by 75 per cent of female students, and the difference between the pass rates was thus 18 percentage points. Sixty-eight per cent of male students had completed a higher or lower degree in 12.5 years. For women, the corresponding proportion was 85 per cent, while the difference between the pass rates of sexes was 17 percentage points.
Pass rates of university education for young people in 2012 and 2011 by sex for those having studied for 5.5 to 6.5 years (lower and higher university degrees)
| Sector of education | Duration of studies (years) | Gender | Pass rate 2012 (%) | Pass rate 2011 (%) | Difference between pass rates in 2012–2011 |
| University education (lower and higher university degrees) | 5,5 | Men | 36,9 | 37,3 | - 0,4 |
| Women | 58,6 | 57,8 | 0,8 | ||
| 6,5 | Men | 49,6 | 47,2 | 2,4 | |
| Women | 68,8 | 68,5 | 0,3 |
Changes in the pass rates for university education were small between the data for 2011 and for 2012. Only the pass percentage for male students having completed education in at most six-and-a-half years changed by over one percentage point, having grown by around two percentage points.
Upper secondary general school was completed in four instead of three years more often than before
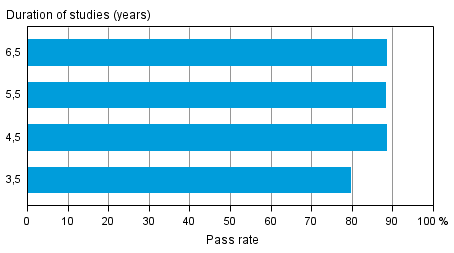
According to the data for 2012, upper secondary general education was completed typically in 3.5 to 4.5 years: Eighty per cent of new students in upper secondary general schools completed the upper secondary general school syllabus in at most three-and-a-half years and 88 per cent in at most four-and-a-half years. When the duration of studies was more than four-and-a-half years, the number of completers of upper secondary general education in relation to the number of those starting education settled between 88 and 89 per cent.
Pass rates for upper secondary general education aimed at young people in different reference periods by the end of 2012

Men studying in upper secondary general school passed their qualifications slower than women studying there did. Seventy-nine per cent of men completed their upper secondary general school qualification in three-and-a-half years, while for women, the corresponding figure was 80 per cent.
Pass rates of upper secondary general education aimed at young people in 2012 and 2011 by gender for those having studied for 3.5 to 4.5 years
| Sector of education | Duration of studies (years) | Gender | Pass rate 2012 (%) | Pass rate 2011 (%) | Difference between pass rates in 2012–2011 |
| Upper secondary general education aimed at young people | 3,5 | Men | 78,7 | 80,5 | - 1,8 |
| Women | 80,1 | 80,2 | - 0,1 | ||
| 4,5 | Men | 88,0 | 86,5 | 1,5 | |
| Women | 88,8 | 88,3 | 0,5 |
According to the statistics for 2012, men particularly completed upper secondary general school more often than before in at most four-and-a-half years. The number of men completing upper secondary general education in three-and-a-half years fell by around two percentage points from the situation of 2011 to that at the end of 2012. At the same time, the number of male students having completed upper secondary general school in at most four-and-a-half years grew by nearly as much, by around two percentage points. The change for women was similar, but smaller.
Men completed vocational qualifications more often than women in three-and-a-half or four-and-a-half years
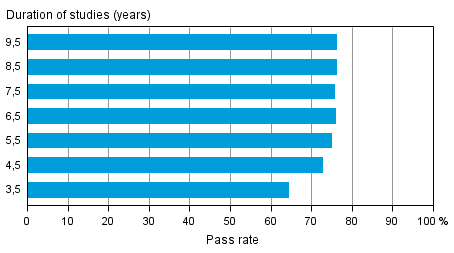
The duration of qualifications completed in vocational education for young people varies more than that of upper secondary general qualifications. Sixty-four per cent of vocational education students passed their vocational qualifications in three-and-a-half years or faster. Seventy-three per cent of students completed their education in at most four-and-a-half years.
The pass rate for vocational education grew yearly slightly even for those having studied the longest time: 75 per cent of those having started studies five-and-a-half years earlier and 76 per cent of those having started nine-and-a-half year earlier had completed their qualifications by the end of 2012.
Pass rates for vocational education aimed at young people in different reference periods by the end of 2012

The completion time for vocational education varied between men and women. Sixty-five per cent of male students passed a vocational qualification in three-and-a-half years and 73 per cent in four-and-a-half years. Of female students, 64 per cent completed a vocational qualification in three-and-a-half years and 72 per cent in four-and-a-half years, which is slightly less than the corresponding figures for men.
Seventy-five per cent of vocational education students had completed education in five-and-a-half years, and there were not differences between men's and women's pass rates.
When the duration of studies was over five-and-a-half years, women completed the qualifications they had started more often than men did. For example, 77 per cent of women completed vocational education in at most six-and-a-half years, while the corresponding figure for men was 75 per cent. The difference is slightly bigger for the cohort having started studies nine-and-a-half years ago: 79 per cent of women having started studying nine-and-a-half years earlier completed vocational education by the end of 2012, while the respective figure for men was 74 per cent.
Pass rates of vocational education aimed at young people in 2012 and 2011 by sex for those having studied for 3.5 to 4.5 years
| Sector of education | Duration of studies (years) | Gender | Pass rate 2012 (%) | Pass rate 2011 (%) | Difference between pass rates in 2012–2011 |
| Vocational education aimed at young people | 3,5 | Men | 65,0 | 66,0 | - 1,0 |
| Women | 63,5 | 63,7 | - 0,2 | ||
| 4,5 | Men | 73,4 | 72,1 | 1,3 | |
| Women | 72,0 | 71,7 | 0,3 |
As in upper secondary general education, men also completed a qualification in vocational education more often than before in four-and-a-half years instead of three-and-a-half years.
The database tables of these statistics contain information on the differences between the pass rates for different fields of sectors of education (see Tables in databases ). The database tables also include information on those students who did not attain their qualification in the target time.
In these statistics, the number of completers of education relative to starters of education has increased particularly for tertiary level education. Other statistics also indicate that studying was more interesting than in the year before, as both discontinuation of education and employment of students decreased ( Discontinuation of education , Employment of students ).
Source: Education Statistics, Statistics Finland
Inquiries: Suvi Vainio 09 1734 2915, koulutustilastot@stat.fi
Director in charge: Riitta Harala
Publication in pdf-format (315.1 kB)
- Tables
-
Tables in databases
Pick the data you need into tables, view the data as graphs, or download the data for your use.
Appendix tables
- Appendix table 1. Progress of new upper secondary school students (aimed at young people) studies by end 2012 (20.3.2014)
- Appendix table 2. Progress of new students studies in vocational education (aimed at young people) by end 2012 (20.3.2014)
- Appendix table 3. Progress of new polytechnic students studies by end 2012, youth education (20.3.2014)
- Appendix table 4. Progress of new university students studies by end 2012, lower or higher university degrees (20.3.2014)
Updated 20.3.2014
Official Statistics of Finland (OSF):
Progress of studies [e-publication].
ISSN=1799-1021. 2012. Helsinki: Statistics Finland [referred: 20.4.2025].
Access method: http://stat.fi/til/opku/2012/opku_2012_2014-03-20_tie_001_en.html

