This set of statistics has been discontinued.
New data are no longer produced from the statistics.
Published: 25 October 2007
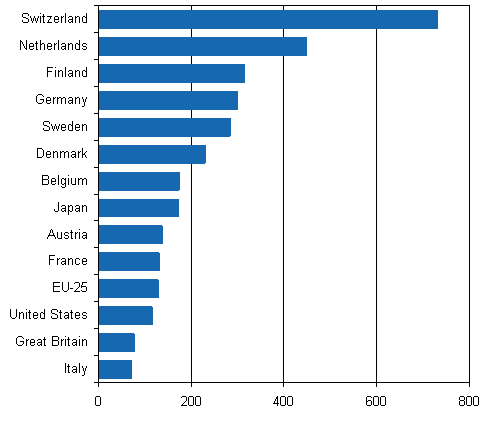
Finland has the third highest number of European patent applications, relative to population
Relative to population, the number of European patent applications filed in Finland was the third highest in 2006. Switzerland held the top position with 730 applications per one million population. Calculated for all EU countries, the corresponding number was 130 applications.
In 2006, Finnish applicants filed 1,015 PCT (Patent Cooperation Treaty) applications with the National Board of Patents and Registration of Finland, while the number of PCT applications was 1,056 the year before. Finnish applicants filed 1,678 patent applications with the European Patent Office, of which 424 were direct applications and the rest were PCT applications in the regional stage.
A total of 2,018 patent applications were filed directly with the National Board of Patents and Registration of Finland in 2006. This was 43 applications down from the year before. Applications filed directly from abroad numbered 205. The majority of foreign patent applications came from the United States (52), Germany (40) and Sweden (37). The reason for the sharp drop in the number of foreign patent applications is the increasing changeover to international patenting.
The number of applications filed by Finnish applicants fell by 22 from the year before. Enterprises and associations filed 77 per cent of domestic patent applications and the rest were filed by private individuals.
In 2006, a domestic patent application was filed by 526 enterprises or associations. The number was down by 13 applications from the previous year. Sixteen enterprises filed patent applications jointly with some other applicant, and 18 enterprises filed 10 or more applications. Most enterprises filed only one patent application; in 2006 such enterprises numbered 354.
The highest number of patent applications was filed in the field of performing operations and transporting. According to the International Patent Classification, the majority of the domestic patent applications filed in Finland in 2006, or 23 per cent, were in the section of performing operations and transport. The second biggest section was electricity, accounting for 17 per cent of all applications. Among foreign applications, electricity was the biggest section with a 36 per cent share, and the next biggest share of applications, at 14 per cent, was filed in the section of mechanical engineering.
European patent applications per one million population in 2006

Source: Patenting 2006. Statistics Finland
Inquiries: Markku Virtaharju (09) 1734 3290
Director in charge: Kaija Hovi
Publication in pdf-format (20 pages 407.0 kB)
- Reviews
-
- 1.1 Patent statistics as technology indicators (25.10.2007)
- 1.2 Patenting in Finland (25.10.2007)
- 1.3 International patenting (25.10.2007)
- 1.4 Material and concepts (25.10.2007)
- Tables
-
Tables in databases
Pick the data you need into tables, view the data as graphs, or download the data for your use.
Appendix tables
- 1. Patent applications filed in Finland in 1985-2006 (25.10.2007)
- 2. Domestic patent applications by region in 2000, 2002, 2004 and 2006 (25.10.2007)
- 3. Patent applications filed by enterprises and associations in Finland by industry in 2000, 2003 and 2006 (25.10.2007)
- Patents granted in Finland by IPC section in 2006 (25.10.2007)
- 5. Patents granted to enterprises and associations by industry in 2000-2006 (25.10.2007)
- 6. European patents granted in 2001 and 2006 (25.10.2007)
- 7. Patents granted to selected countries in the United States in 2001 and 2006 (25.10.2007)
- 8. Triadic patent families in selected countries in 1999-2003 (25.10.2007)
- 9. Partner countries in patents granted to Finnish inventors in 2006 (25.10.2007)
- Figures
-
- 1. Patent applications filed in Finland by IPC section in 2006 (25.10.2007)
- 2. Patents granted and European patents validated in 2000 - 2006 (25.10.2007)
- 3. Patents granted in Finland in 2006 (25.10.2007)
- 4. European patents granted in 1990-2006 (25.10.2007)
- 5. Selected countries shares of European patenting in 2006 (25.10.2007)
- 6. European patent applications per one million population in selected countries in 2006 (25.10.2007)
- 7. Patents granted in the United States in 1990-2006 (25.10.2007)
- 8. Triadic patent families in 1990-2005 (25.10.2007)
- 9. Triadic patent families per one million population in 1995 and 2005 (25.10.2007)
- 10. Selected countries shares of triadic patent families in 1995 and 2005 (25.10.2007)
- 11. Domestic ownership of foreign inventions (25.10.2007)
- 12. Foreign ownership of domestic inventions (25.10.2007)
- 13. Joint inventions share of domestic inventions (25.10.2007)
Updated 25.10.2007
Official Statistics of Finland (OSF):
Patenting [e-publication].
ISSN=1797-3023. 2006. Helsinki: Statistics Finland [referred: 19.4.2025].
Access method: http://stat.fi/til/pat/2006/pat_2006_2007-10-25_tie_001_en.html

