1. Married couple without children is the commonest family type
Families are classified according to whether the spouses are married, cohabiting or in a registered partnership and whether they have children. In addition to this, one-parent families are a separate category. In this classification, no limit is set as to the age of a child. Families with underage children, defined as families having at least one child under the age of 18 living at home, are discussed in Section 3. Where families with underage children are concerned, parents are also referred to as supporters. In the following examination, one-parent families are not only single-supporter families, as a person having the status of a child living with his/her mother or father may be of any age.
At the end of 2016, there were 1,476,000 families in Finland. The number grew by 248 from the year before. The increase was 1,421 lower than in the previous year.
Altogether 74 per cent of the population belongs to a family. The proportion has decreased by 0.4 percentage points from the previous year. The rate of its decrease has remained at this level since the beginning of the 1990s. The proportion of the family population was at its highest in the 1960s and 1970s, when 87 per cent of the population belonged to a family. The number of persons belonging to a family fell by 8,000 during 2016. The country's total population increased by 16,000 persons. At the end of 2016, the average size of a family in Finland was 2.8 persons.
Table 1. Family population and average size of family in 1950–2016
| Year | Families total |
Family population |
Population | Proportion of family population, % |
Average size of family |
| 1950 | 930 572 | 3 457 474 | 4 029 803 | 85,8 | 3,7 |
| 1960 | 1 036 270 | 3 855 037 | 4 446 222 | 86,7 | 3,7 |
| 1970 | 1 153 878 | 3 986 005 | 4 598 336 | 86,7 | 3,5 |
| 1980 | 1 278 102 | 4 023 091 | 4 787 778 | 84,0 | 3,1 |
| 1990 | 1 365 341 | 4 101 922 | 4 998 478 | 82,1 | 3,0 |
| 2000 | 1 401 963 | 4 053 850 | 5 181 115 | 78,2 | 2,9 |
| 2010 | 1 455 073 | 4 065 168 | 5 375 276 | 75,6 | 2,8 |
| 2012 | 1 465 733 | 4 075 094 | 5 426 674 | 75,1 | 2,8 |
| 2013 | 1 471 085 | 4 081 903 | 5 451 270 | 74,9 | 2,8 |
| 2014 | 1 473 666 | 4 084 001 | 5 471 753 | 74,6 | 2,8 |
| 2015 | 1 475 335 | 4 080 544 | 5 487 308 | 74,4 | 2,8 |
| 2016 | 1 475 583 | 4 072 565 | 5 503 297 | 74,0 | 2,8 |
The commonest family type in Finland is still a married couple without children, making up 36 per cent of all families in 2016. As recently as in 2004, the most common family type in Finland was a married couple with children of some age living at home. Twenty-eight per cent of all families were families of a married couple with children in 2016. The number of such families has been on the decline for a long time, whereas the number of married couples without children has been rising. The number of married couples living with their children decreased by 6,200 from the previous year, whereas in the early 2000s the decrease was as high as 10,000 per year.
The number and proportion of cohabiting couples among families is also growing. However, cohabiting couples without children still make up only 15 per cent of all families. Today, eight per cent of all families are cohabiting couples with children. The number and relative share of families with cohabiting couples have grown slowly in recent years.
"Mother and children" families represent ten per cent of all families. “Father and children” families are still rare; they number only two in one hundred. Their relative proportion has not changed much over the past few years.
Table 2. Families by type in 1950–2016
| Year | Total | Married couple without children |
Married couple with children |
Cohabiting couple with children |
Cohabiting couple without children |
Mother and children |
Father and children |
Registered male couple 1) |
Registered female couple 1) |
| 1950 | 930 572 | 176 650 | 593 763 | .. | .. | 137 803 | 22 356 | .. | .. |
| 1960 | 1 036 270 | 207 897 | 678 822 | .. | .. | 129 706 | 19 845 | .. | .. |
| 1970 2) | 1 153 878 | 260 562 | 722 001 | 6 800 | 19 100 | 126 394 | 19 021 | .. | .. |
| 1980 3) | 1 278 102 | 302 818 | 711 226 | 36 200 | 65 900 | 140 725 | 21 233 | .. | .. |
| 1990 | 1 365 341 | 364 452 | 640 062 | 65 896 | 123 471 | 147 297 | 24 161 | .. | .. |
| 2000 | 1 401 963 | 436 019 | 514 868 | 102 581 | 160 132 | 159 432 | 28 931 | .. | .. |
| 2010 | 1 455 073 | 513 889 | 446 433 | 117 254 | 195 967 | 149 651 | 30 278 | 706 | 895 |
| 2011 | 1 460 570 | 518 550 | 442 257 | 118 054 | 200 171 | 149 196 | 30 534 | 773 | 1 035 |
| 2012 | 1 465 733 | 523 221 | 439 194 | 118 136 | 203 334 | 149 143 | 30 714 | 829 | 1 162 |
| 2013 | 1 471 085 | 525 933 | 434 571 | 120 040 | 208 264 | 149 110 | 30 955 | 905 | 1 307 |
| 2014 | 1 473 666 | 527 238 | 429 811 | 121 499 | 211 673 | 149 668 | 31 342 | 991 | 1 444 |
| 2015 | 1 475 335 | 528 539 | 424 185 | 121 657 | 215 620 | 150 274 | 31 452 | 1 023 | 1 585 |
| 2016 | 1 475 583 | 529 697 | 418 032 | 123 321 | 218 439 | 151 459 | 31 951 | 1 052 | 1 632 |
| % | |||||||||
| 1950 | 100,0 | 19,0 | 63,8 | .. | .. | 14,8 | 2,4 | .. | .. |
| 1960 | 100,0 | 20,1 | 65,5 | .. | .. | 12,5 | 1,9 | .. | .. |
| 1970 2) | 100,0 | 22,6 | 62,6 | 0,6 | 1,7 | 11,0 | 1,6 | .. | .. |
| 1980 3) | 100,0 | 23,7 | 55,6 | 2,8 | 5,2 | 11,0 | 1,7 | .. | .. |
| 1990 | 100,0 | 26,7 | 46,9 | 4,8 | 9,0 | 10,8 | 1,8 | .. | .. |
| 2000 | 100,0 | 31,1 | 36,7 | 7,3 | 11,4 | 11,4 | 2,1 | .. | .. |
| 2010 | 100,0 | 35,3 | 30,7 | 8,1 | 13,5 | 10,3 | 2,1 | 0,0 | 0,1 |
| 2011 | 100,0 | 35,5 | 30,3 | 8,1 | 13,7 | 10,2 | 2,1 | 0,1 | 0,1 |
| 2012 | 100,0 | 35,7 | 30,0 | 8,1 | 13,9 | 10,2 | 2,1 | 0,1 | 0,1 |
| 2013 | 100,0 | 35,8 | 29,5 | 8,2 | 14,2 | 10,1 | 2,1 | 0,1 | 0,1 |
| 2014 | 100,0 | 35,8 | 29,2 | 8,2 | 14,4 | 10,2 | 2,1 | 0,1 | 0,1 |
| 2015 | 100,0 | 35,8 | 28,8 | 8,3 | 14,6 | 10,2 | 2,1 | 0,1 | 0,1 |
| 2016 | 100,0 | 35,9 | 28,3 | 8,4 | 14,8 | 10,3 | 2,2 | 0,1 | 0,1 |
2) The breakdown of the census by type of family has been revised on the basis of interview surveys. (Aromaa, Cantell & Jaakkola: Avoliitto (Consensual Union), Research Institute of Legal Policy 49, Helsinki 1981).
3) The breakdown of the census by type of family has been revised on the basis of the 1981 register-based material on families and cohabiting couples.
1.1 Children of women aged 53 have moved away from home
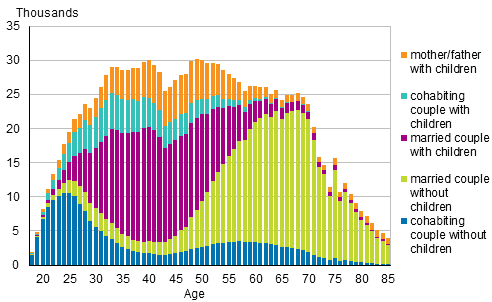
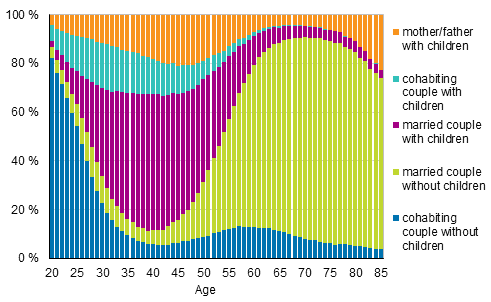
Women's family types differ at different life stages. The most typical family type for women aged under 29 with family is "cohabiting couple without children". Already for women aged 29, the commonest family type is “married couple with children”. This is natural as nowadays the first child is born at the average age of 29.1 and the first marriage is contracted at the average age of 31.4. “Married couple without children” only becomes the most typical family type for women once they have turned 53. The families of the oldest women (at least 92 years of age) tend to include a child more often than a husband. However, just nine per cent of women of this age belong to the family population. In the light of family statistics, old age is different for men than for women. Thirty-five per cent of the men aged at least 92 belong to families. Then the family is typically a married couple without any children living with them.
Figure 1A. Families by type and age of wife/mother in 2016 (families with father and children by age of father)

Figure 1B. Families by type and age of wife/mother in 2016 (families with father and children by age of father), relative breakdown

1.2 Growth in the number of registered partnerships slowed down
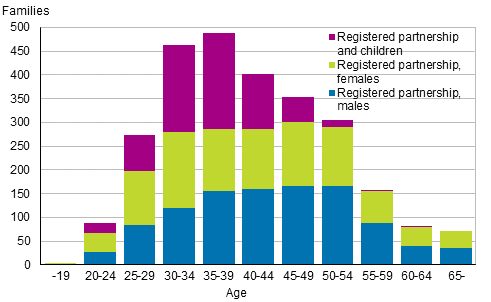
At the end of 2016, there were 1,052 male couples and 1,632 female couples in a registered partnership, which is a total of 76 couples more than in 2015. In the year before, the number still grew by 170 couples. This may be due to the new Marriage Act, which same-sex couples have chosen to wait for. In most of the tables in this publication these families are included in married couples. In some of the tables on the whole country, these families form a group of their own. For reasons of privacy protection, this information can be given by municipality only if the number of couples is at least ten.
Figure 2 shows the age distribution of registered male and female couples according to the younger partner. In the other figures, registered couples are included in married couples. The number of registered couples is so low that they would not be distinguishable as a separate group in figures concerning all families.
Figure 2. Registered partnerships by age of younger partner in 2016

1.3 Eighty-one per cent of married couples are in their first marriage
Up to the age of 38, women without children tend to prefer cohabitation to marriage. Where mothers are concerned, the only ones to favour cohabitation over marriage are in the small group of mothers aged under 26. The majority of mothers older than this living with their spouses are married. The older the woman, the more likely she is to be married.
Married couples account for 64 per cent of all families and for 73 per cent of all partnerships. Cohabiting couples make up 23 per cent of all families and 26 per cent of all partnerships.
In 81 per cent of all married couples both spouses are married for the first time. In 68 per cent of cohabiting couples neither spouse has been previously married. Hence, on average, there are clearly more couples where one of the spouses has been married before among cohabiting couples than among married couples. In 89 per cent of the registered male couples neither partner has been married before, the figure for female couples is 82 per cent.
1.4 Three-quarters of cohabiting partners are unmarried
Seventy-four per cent of the women and 75 per cent of the men living with a cohabiting partner without children are unmarried, so there is hardly any difference between genders here. More cohabiting women than cohabiting men are widows. There is not much difference in the marital status of women and men living with children and cohabiting partners.
Table 3. Marital status of the man/woman/father/mother in a cohabiting partnership and in a one-parent family in 2016, %
| Marital status |
Type of family | |||||||
| Cohabiting man no children |
Cohabiting woman no children |
Cohabiting man with children |
Cohabiting woman with children |
Father and children |
Father and children aged 17 or under |
Mother and children |
Mother and children aged 17 or under |
|
| Unmarried | 75,1 | 74,1 | 78,5 | 79,1 | 20,7 | 27,9 | 33,5 | 41,5 |
| Married | 0,7 | 0,6 | 0,5 | 0,5 | 13,2 | 15,0 | 10,5 | 12,6 |
| Divorced | 22,5 | 21,6 | 20,5 | 19,5 | 51,3 | 52,6 | 42,9 | 43,4 |
| Widowed | 1,7 | 3,7 | 0,5 | 0,9 | 14,8 | 4,5 | 13,1 | 2,5 |
| Total | 100,0 | 100,0 | 100,0 | 100,0 | 100,0 | 100,0 | 100,0 | 100,0 |
| Number | 218 439 | 218 439 | 123 321 | 123 321 | 31 951 | 17 164 | 151 459 | 105 693 |
Mothers and fathers in one-parent families differ in their marital status. More than one-half of the fathers and 43 per cent of the mothers are divorced. One-third of the mothers are unmarried and around one-fifth of the fathers. However, it should be noted that no limit is set on the age of a child, i.e. we are not referring to single supporters only. The child of a one-parent family can be of any age, meaning that families formed by old widowed mothers and their grown-up children, for example, are included.
Table 3 also contains columns for one-parent families, that is, fathers and mothers whose children are underage. Their marital status structure differs most clearly from the group of all one-parent families: there are fewer widows and more of all other marital status groups. It is worth noting that relatively more fathers than mothers of one-parent families with children are widowed, although fewer fathers than mothers become widowed. In divorces, children usually stay with their mother, but there is no choice in the case of death. Of mothers of one-parent families with children, 42 per cent are unmarried, some from the start having become mothers without a spouse, but a large number as the result of dissolved cohabitation.
Source: Population and Justice Statistics, Statistics Finland
Inquiries: Marjut Pietilšinen 029 551 2798, Timo Nikander 029 551 3250, Joonas Toivola 029 551 3355, info@stat.fi
Director in charge: Jari Tarkoma
Updated 24.11.2017
Official Statistics of Finland (OSF):
Families [e-publication].
ISSN=1798-3231. Annual Review 2016,
1. Married couple without children is the commonest family type
. Helsinki: Statistics Finland [referred: 19.4.2025].
Access method: http://stat.fi/til/perh/2016/02/perh_2016_02_2017-11-24_kat_001_en.html

