Published: 12 October 2017
Turnover in service industries increased by 7.4 per cent year-on-year in May to July
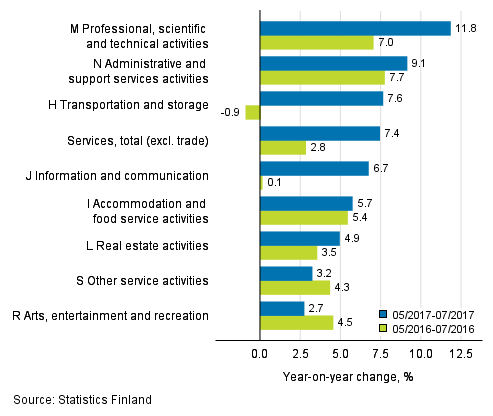
According to Statistics Finland, turnover in service industries grew by 7.4 per cent in May to July from the corresponding period of the year before. All main service industries continued growing. Growth was strongest in professional, scientific and technical activities (+11.8%). Turnover in administrative and support service activities also attained good growth of 9.1 per cent. Among the industries, transportation and storage (+7.6%) and information and communication (+6.7%) continued to grow strongly. Services are here examined exclusive of trade.
Three months' year-on-year change in turnover in services (TOL 2008)

Among the sub-industries of professional, scientific and technical activities, growth was driven by other professional, scientific and technical activities (+16.6%) and architectural and engineering activities (+13.3%). In administrative and support service activities, growth was, in turn, boosted by renting and leasing activities (+15.6%) and employment activities (+13.9%).
In information and communication activities, growth was generated by motion picture, video and television programme production, sound recording and music publishing activities that grew strongly (+27.1%). Turnover development was also positive for information service activities (+15.2%).
The development in the main industry of other service activities was slowed down especially by the 8.6 per cent drop in the turnover of repair of computers and personal and household goods. Among the main service industries, weakest growth was seen in arts, entertainment and recreation activities (+2.7%).
Changes in the Tax Administration's self-assessed tax data have not so far had an effect on the data of turnover indices
The effects of the changes in the Tax Administration's self-assessed tax data have been analysed in Statistics Finland’s turnover indices. Based on the analyses, no significant changes for statistics production were observed in the value added tax reporting of enterprises. More about this under Changes in the periodic tax return data used in turnover indices.
Source: Turnover of service industries, Statistics Finland
Inquiries: Aki Niskanen 029 551 2657, Katja Liukkonen 029 551 3515, palvelut.suhdanne@stat.fi
Director in charge: Sami Saarikivi
Publication in pdf-format (292.9 kB)
- Tables
-
Tables in databases
Pick the data you need into tables, view the data as graphs, or download the data for your use.
Appendix tables
- Figures
- Revisions in these statistics
-
- Revisions in these statistics (12.10.2017)
Updated 12.10.2017
Official Statistics of Finland (OSF):
Turnover of service industries [e-publication].
ISSN=1799-0998. July 2017. Helsinki: Statistics Finland [referred: 19.4.2025].
Access method: http://stat.fi/til/plv/2017/07/plv_2017_07_2017-10-12_tie_001_en.html

