This set of statistics has been discontinued.
Statistical data on this topic are published in connection with another set of statistics.
Data published after 5 April 2022 can be found on the renewed website.
1. Review on offences recorded by the police, customs and border guard
1.1. Abstract
In 2012, 425,000 offences were recorded by the police, customs and border guard in the whole country, which is seven per cent less than one year before. During ten previous years, the average number of offences recorded was 438,000 per year. Over the year, 255,000 offences were solved, while the corresponding figure was 271,000 one year previously.
The vast majority of the offences were recorded by the police. A total of 14,000 offences were recorded by the customs and border guard, 20 per cent more than one year before. One-quarter of the offences recorded by the customs and border guard were alcohol offences or minor alcohol offences and narcotics offences.
Viewed by region, the number of offences decreased from 2011 to 2012 in all regions. The offences decreased the most in relative terms in Central Ostrobothnia, by 16 per cent.
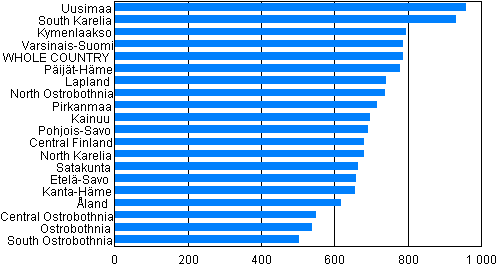
Figure 1. Offences by region per 10,000 population in 2012
1.2. Offences against property
The biggest group of the offences recorded was formed by thefts, petty thefts and aggravated thefts. In all, 139,000 of them were recorded, which is eight per cent less than one year previously. An average of 156,000 theft offences (thefts, petty thefts and aggravated thefts) were reported between 2002 and 2011. The number of thefts recorded in 2012 was 68,000, or 10 per cent less than one year before. The number of aggravated thefts recorded was 3,200. During ten previous years, 2,600 aggravated thefts, on average, were committed per year. Petty thefts numbered 68,000, which is seven per cent less than in the year before.
Figure 2. Offences against property 2012 (In total 237,609 offences)
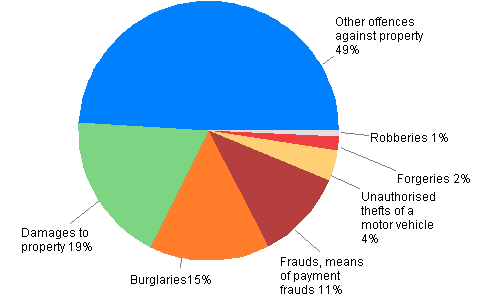
The number of burglaries reported was 35,000, which is 4,600 cases less than in the previous year. The number of burglaries of motor vehicles recorded was 11,000, which is 22 per cent fewer than one year previously. Breaking into business premises decreased by 12 per cent. The number recorded was now 4,000. From 2002, their number has decreased by 42 per cent. The total number of break-ins into houses went down by six per cent compared with the previous year. In 2012, their number was 6,300, of which 1,500 where break-ins to cottages.
The recorded number of unauthorised uses and thefts of a motor vehicle and thefts of use of a motor vehicle was 8,800, which was approximately one-quarter less than in the year before.
In 2012, 1,200 accounting and debtor offences were recorded, which is five per cent more than in the previous year. Although the number of these offences is good one half of the record figures for 1996, their number has more than doubled from 1991.
The number of frauds was 21,000, which is 18 more than in 2011. Ten years ago, 12,000 frauds were recorded. A total of 6,200 means of payment frauds were committed, the amount has nearly doubled over the past five years.
The number of damages to property was 51,000 per year, on average, during the previous ten-year period. Now 44,000 of them were reported, which is 19 per cent less than in the previous year.
A total of 1,600 robberies were reported, which was at the same level as last year. From 2002 to 2011, the average number of robberies per year has been 1,800.
Table 1. Selected offences against property by region per 10,000 population in 2012
| Region | Burglaries | Unauthorised thefts of a motor vehicle |
Robberies | Damages to property |
Embezzlements | Frauds, means of payment- frauds |
| WHOLE COUNTRY | 649 | 163 | 30 | 822 | 61 | 503 |
| Uusimaa | 751 | 189 | 42 | 977 | 94 | 583 |
| Varsinais-Suomi | 778 | 279 | 40 | 706 | 56 | 508 |
| Satakunta | 722 | 146 | 19 | 681 | 44 | 419 |
| Kanta-Häme | 629 | 118 | 22 | 784 | 29 | 504 |
| Pirkanmaa | 641 | 142 | 24 | 918 | 44 | 481 |
| Päijät-Häme | 835 | 203 | 22 | 906 | 65 | 456 |
| Kymenlaakso | 656 | 163 | 19 | 790 | 44 | 438 |
| South Karelia | 486 | 138 | 26 | 830 | 42 | 333 |
| Etelä-Savo | 690 | 155 | 13 | 748 | 40 | 350 |
| Pohjois-Savo | 487 | 112 | 17 | 780 | 48 | 316 |
| North Karelia | 488 | 109 | 13 | 723 | 28 | 457 |
| Central Finland | 594 | 85 | 25 | 745 | 58 | 458 |
| South Ostrobothnia | 340 | 45 | 13 | 544 | 31 | 381 |
| Ostrobothnia | 433 | 88 | 9 | 784 | 20 | 315 |
| Central Ostrobothnia | 285 | 48 | 10 | 656 | 16 | 239 |
| North Ostrobothnia | 592 | 201 | 40 | 654 | 54 | 469 |
| Kainuu | 394 | 116 | 16 | 832 | 46 | 236 |
| Lapland | 537 | 168 | 27 | 761 | 52 | 384 |
| Åland | 497 | 74 | 0 | 776 | 95 | 138 |
1.3. Offences against the person
In 2012, a total of 38,000 assault offences were recorded, which is five per cent less than in the corresponding period of 2011. The law reform that entered into force at the beginning of 2011, increased the number of assault offences recorded in 2011. Over the period 2002 to 2011 an average of 32,000 assault offences were recorded per year. Aggravated assaults decreased by nine per cent compared to the previous year and amounted to 1,900.
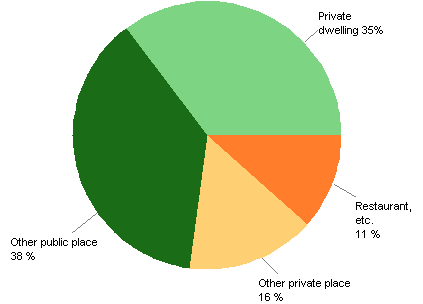
Good one-third of assault offences are committed in private dwellings. In one-third of the cases, the scene of the assault is a public place outside business centres and public occasions.
Figure 3. Assault offences by scene in 2012 (In total 38,231 offences)
The recorded number of offences against life was 89. This was 25 cases less than in 2011. The annual average was 120 for the ten-year period 2002 to 2011. The corresponding figure was 143 between 1992 and 2001. The number of attempted manslaughters, murders or homicides increased from 306 to 350. The average for the previous ten-year period was 340.
In 2012, nearly two-thirds of the offences against life were committed in a private dwelling.
The number of rapes recorded was 1,009, against 1,039 in the previous year. From 2002 to 2011, an average of 710 rapes were reported. The recorded number of sexual exploitations of a child was 1,567, which is 51 per cent (526 cases) more than the annual average for the period 2002 to 2011. The numbers of rapes and sexual exploitations of a child vary much yearly. Individual reports of an offence may include a series of incidents comprising several criminal acts.
Table 2. Selected violent offences by region per 10,000 population in 2012
| Region | Manslaughter, murder, homicide and their attempts |
Assault | Aggravated assault |
Petty assault |
Rape offences |
| WHOLE COUNTRY | 8 | 470 | 35 | 203 | 19 |
| Uusimaa | 9 | 570 | 29 | 231 | 21 |
| Varsinais-Suomi | 3 | 417 | 30 | 234 | 18 |
| Satakunta | 8 | 425 | 43 | 154 | 11 |
| Kanta-Häme | 9 | 312 | 34 | 187 | 20 |
| Pirkanmaa | 5 | 424 | 36 | 193 | 22 |
| Päijät-Häme | 12 | 418 | 31 | 188 | 11 |
| Kymenlaakso | 13 | 326 | 29 | 208 | 14 |
| South Karelia | 6 | 350 | 40 | 189 | 11 |
| Etelä-Savo | 8 | 407 | 38 | 243 | 17 |
| Pohjois-Savo | 11 | 448 | 36 | 294 | 17 |
| North Karelia | 14 | 356 | 37 | 173 | 16 |
| Central Finland | 7 | 548 | 44 | 145 | 20 |
| South Ostrobothnia | 11 | 385 | 34 | 113 | 13 |
| Ostrobothnia | 3 | 380 | 39 | 156 | 15 |
| Central Ostrobothnia | 13 | 542 | 29 | 225 | 16 |
| North Ostrobothnia | 8 | 478 | 35 | 137 | 21 |
| Kainuu | 10 | 613 | 50 | 209 | 20 |
| Lapland | 9 | 477 | 52 | 238 | 20 |
| Åland | 7 | 423 | 25 | 180 | 11 |
1.4. Drunken driving and traffic offences
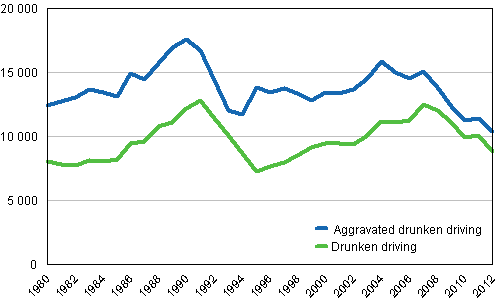
Aggravated drunken driving decreased by nine per cent and other drunken driving by 12 per cent. In all, 19,000 drunken driving offences were recorded, which is 11 per cent less than in 2011. The number of drunken driving offences known to the police was at its lowest in 30 years in 2012. They have fallen by one-third from the 1990 record figures.
Of those suspected of drunken driving, 83 per cent had used alcohol and 14 per cent a narcotic substance as their only intoxicant. The remaining three per cent had used both.
Figure 4. Drunken driving offences in 1980–2012
In 2012, 435,000 cases of endangerment of traffic safety and traffic infractions were registered, which is 14 per cent lower than one year before. Most of them were infractions found out in connection with police surveillance and guidance. The recorded number of aggravated endangerment of traffic safety was 3,600, which is 12 per cent fewer than in 2011. The police recorded 289,000 cases of exceeding speed limits, which was 14 per cent less than in the year before.
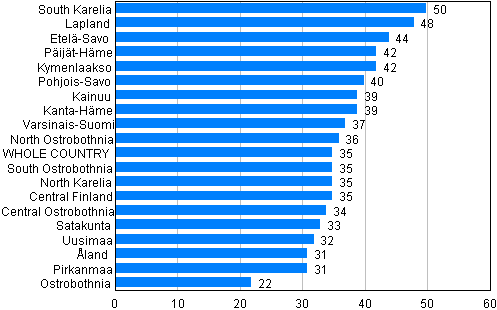
Figure 5. Drunken driving offences by region per 10,000 population in 2012
1.5. Offences involving intoxicating substances
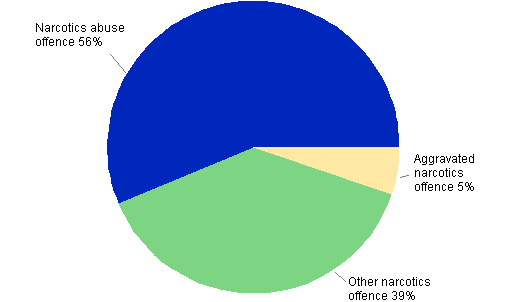
In all, 20,000 narcotics offences were recorded in 2012, which is one per cent less than in 2011. Aggravated narcotics offences also went down by one per cent to 1,000. During the period 2002 to 2011, the average number of narcotics offences was 16,000 per year.
From 2009, the figures include the offences recorded by the customs and border guard, which increases the number of narcotics offences by about one-tenth compared with narcotics offences known to the police.
Figure 6. Narcotics offences in 2012 (In total 20,102 offences)
In all, 4,600 alcohol offences and minor alcohol offences were recorded. The number was 10 per cent lower than one year previously.
When compiling statistics on offences involving intoxicating substances, offences comprising several criminal acts are entered as one. Offences involving intoxicating substances are such that they are generally found out only as a result of the activity of only the police or customs and border guard officials and the majority of the offences remain undisclosed.
1.6. Solved offences
During 2012, the police, customs and border guard solved a total of 255,000 offences. The clearance rate was 60 per cent, which is one percentage point higher than in the previous year. The corresponding figure was 52 per cent ten years ago. The clearance rate for offences is calculated so that the offences recorded by the police in the statistical reference year and all the offences solved in that same year are compared with each other.
Thirty-eight per cent of offences against property and 78 per cent of offences against life and health were solved.
Among municipalities of over 30,000 inhabitants the clearance rate was the highest in Savonlinna and Lappeenranta, 71 and 69 per cent, respectively, while it was the lowest in Helsinki and Kaarina, 54 per cent in both.
The clearance rate varies by type of offence quite strongly. Due to the manner of disclosure, drunken driving, traffic and offences involving intoxicating substances are almost all solved. Sixty-eight per cent of frauds and 88 per cent of offences against life were solved. The clearance rate is 77 per cent for assault offences.
The clearance rates are the lowest for theft offences (theft, aggravated theft, petty theft), damages to property, means of payment frauds and unauthorised thefts of a motor vehicle. In 2012, one-sixth of thefts were solved. One-quarter of damages to property and one-fifth of means of payment frauds were cleared. One-third of unauthorised thefts of a motor vehicle were solved. Good half of robberies were solved.
Table 3. Clearance rate of certain types of offences in 1986–2012
| Offence | 1986–1990 | 1991–1995 | 1996–2000 | 2001–2005 | 2006–2010 | 2011 | 2012 |
| ALL OFFENCES | 65 | 51 | 51 | 56 | 61 | 59 | 60 |
| Theft | 25 | 17 | 14 | 15 | 18 | 17 | 16 |
| Aggravated theft | 39 | 29 | 40 | 41 | 38 | 34 | 38 |
| Petty theft | 78 | 70 | 67 | 58 | 57 | 57 | 56 |
| Robbery | 53 | 43 | 42 | 45 | 49 | 49 | 54 |
| Damages to property | 29 | 27 | 27 | 26 | 25 | 21 | 23 |
| Assault | 79 | 74 | 76 | 80 | 81 | 75 | 78 |
| Aggravated assault | 85 | 84 | 83 | 87 | 88 | 85 | 83 |
| Petty assault | 95 | 86 | 79 | 75 | 73 | 73 | 75 |
| Manslaughter, murder or homicide | 97 | 94 | 90 | 93 | 91 | 81 | 88 |
| Attempted manslaughter, murder or homicide | 95 | 91 | 92 | 94 | 97 | 91 | 97 |
| Rape | 63 | 56 | 57 | 63 | 66 | 59 | 128 1) |
1.7. Persons suspected of offences
In all, 284,000 persons were suspected of the 255,000 offences solved in 2012. Women made up 18 per cent of these persons.
In addition to the quantitative difference, the criminality of men and women differs in that women's shares of assaults, drunken driving and damages to property are small compared to men. However, the share of women suspected of assaults and drunken driving has doubled in 20 years. Typical crimes for women are petty thefts, embezzlements and forgeries.
Table 4. Suspects of solved offences by age and sex in 2003–2012
| Year | Persons suspected of offences - Age | |||||||||
| Males total |
Females total |
Males aged under 15 |
Females aged under 15 |
Males aged 15–17 |
Females aged 15–17 |
Males aged 18–20 |
Females aged 18–20 |
Males aged over 20 |
Females aged over 20 |
|
| 2003 | 236 391 | 42 097 | 7 600 | 2 590 | 19 033 | 4 127 | 35 161 | 5 300 | 174 597 | 30 080 |
| 2004 | 250 087 | 47 028 | 8 342 | 3 182 | 20 063 | 4 763 | 33 466 | 5 670 | 188 216 | 33 413 |
| 2005 | 250 489 | 46 580 | 7 289 | 3 047 | 22 486 | 4 546 | 31 983 | 5 521 | 188 731 | 33 466 |
| 2006 | 239 264 | 45 093 | 6 934 | 2 725 | 19 296 | 4 093 | 28 830 | 5 783 | 184 204 | 32 492 |
| 2007 | 250 303 | 57 847 | 8 347 | 2 749 | 19 783 | 4 077 | 29 702 | 5 433 | 192 471 | 45 588 |
| 2008 | 257 955 | 50 240 | 10 577 | 3 198 | 20 592 | 4 207 | 30 388 | 5 987 | 196 398 | 36 848 |
| 2009 | 247 229 | 51 298 | 8 846 | 3 173 | 19 049 | 4 635 | 27 261 | 5 923 | 192 073 | 37 567 |
| 2010 | 249 123 | 52 930 | 8 023 | 3 414 | 18 542 | 5 053 | 27 431 | 5 722 | 195 127 | 38 741 |
| 2011 | 248 787 | 53 975 | 9 091 | 3 640 | 19 359 | 5 230 | 28 224 | 5 943 | 192 113 | 39 162 |
| 2012 | 233 726 | 49 896 | 6 930 | 2 738 | 16 532 | 4 338 | 26 485 | 5 439 | 183 779 | 37 381 |
In 2012, the share of young and underage people - aged 21 or under - among all suspects was 22 per cent. The shares of young people were large for alcohol offences, robberies, damages to property and thefts of a motor vehicle. Thirty-five per cent of those suspected of robberies were young people. In damages to property the percentage was 46 and in thefts of a motor vehicle 32. The share of young people suspected of assaults was 21 per cent.
1.8. Foreign citizens
The number of persons suspected of the offences solved in 2012 by the police, customs and border guard was 284,000, of whom 35,000 were citizens of foreign countries. Compared to 2011, the number of all suspects decreased by six per cent, while the number of foreign citizens suspected increased by good two per cent. Over the past ten years, the number of foreign suspects has been 24,000, on average. In 2012, Russians made up the biggest group of foreign suspects, numbering 9,000. Only one-quarter of them reside permanently in Finland. Suspects were citizens of 149 different countries.
Figure 7. Foreign citizens suspected of offences by place of residence in 2009–2012
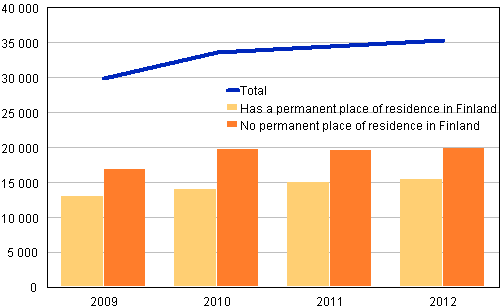
Among the offences solved in 2012, 44 per cent of the suspected foreign citizens were living permanently in Finland. The respective proportion has remained almost unchanged over the past few years. Foreign suspects living in Finland were slightly younger than Finnish suspects were. Their average age was 31 years, while that of Finnish suspects was 32 years. Typical offences by foreigners living in Finland were theft, assault and drunken driving offences, as well as driving a motor vehicle without a license.
In the statistics, the same person can be a suspect several times. Data on the nationality of suspects and on whether they are permanently resident in Finland or not are based on the nationality data derived from the police and those selected by means of the personal identity code from the population data. The group "no permanent place of residence in Finland" is in that sense problematic, because it may include persons staying longer periods in Finland without applying for a permanent place of residence here. The group may also include persons suspected of a narcotics offence, for example, who have come to Finland only for the purpose of committing a crime.
Table 5. Suspects of solved offences living in Finland by age and nationality in 2012
| Age groups | Suspects living permanently in Finland |
Share per 1,000 population in the age group |
||
| Finnish residents | Foreign citizens | Finnish residents | Foreign citizens | |
| Total | 245 870 | 15 418 | 47 | 79 |
| –14 | 8 756 | 517 | 10 | 18 |
| 15–17 | 19 657 | 882 | 108 | 180 |
| 18–20 | 29 348 | 1 459 | 105 | 244 |
| 21–24 | 33 009 | 2 280 | 128 | 176 |
| 25–29 | 35 960 | 2 825 | 114 | 105 |
| 30–34 | 29 275 | 2 235 | 92 | 80 |
| 35–39 | 22 586 | 1 794 | 73 | 80 |
| 40–49 | 36 242 | 2 505 | 54 | 77 |
| 50–59 | 20 945 | 709 | 29 | 38 |
| 60–69 | 7 946 | 152 | 11 | 19 |
| 70– | 2 146 | 60 | 3 | 10 |
1.9. Victims of offences
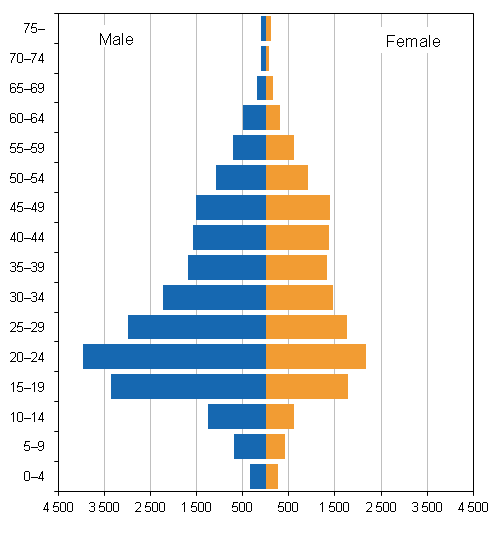
Victims of the assault offences recorded by the police in 2012 numbered 37,000, which is six per cent less than one year earlier. Of the victims, 22,000 (60 per cent) were men and 15,000 (40 per cent) women. The number of male victims was seven per cent and that of female ones five per cent lower than in 2011. The typical age of victims of assault is 18. This age group contained 1,500 (4 per cent) of all victims. In all, 4,800 of those aged 50 or over (13 per cent) were victims of assaults.
Assaults of children aged under 18 decreased by three per cent in 2012 from the year before. Now, there were 5,900 child victims compared with 6,100 in 2011. This is 16 per cent of all victims of assaults. Among child victims, 3,800 (64 per cent) were boys and 2,100 girls (36 per cent). Seventeen per cent of the children belonged to the age group of those aged 0 to 6, 44 per cent to those aged 7 to 14, and 39 per cent to those aged 15 to 17.
Figure 8. Victims of assault offences by age and sex in 2012
Source: Offences known to the police 2012. Statistics Finland
Inquiries: Kimmo Haapakangas 09 1734 3252, rikos@stat.fi
Director in charge: Riitta Harala
Updated 2.4.2013
Official Statistics of Finland (OSF):
Offences known to the police [e-publication].
ISSN=2242-7953. 2012,
1. Review on offences recorded by the police, customs and border guard
. Helsinki: Statistics Finland [referred: 19.4.2025].
Access method: http://stat.fi/til/polrik/2012/polrik_2012_2013-04-02_kat_001_en.html

