Published: 8 April 2011
Growth of earnings was fastest in Satakunta and slowest in Central Ostrobothnia in 2009
Corrected on 7 October 2011 .
Data on the structure of earnings statistics for the year 2009 have been corrected. In the statistics on private sector hourly wages, the data for 2009 were corrected, which also had an effect on the data on the structure of earnings statistics. The data for 2009 were corrected as concerns monthly salaries and hourly wages. In connection with the correction of the error, the numbers have become slightly revised, because the estimation method was reviewed. The erroneous figures for 2009 have now been corrected to the statistical releases and databases.
In 2009, the average monthly earnings were the highest in Uusimaa at EUR 3,285 per month. The regions with the lowest earnings were Etelä-Savo at EUR 2,648 and North Karelia at EUR 2,661. The growth of earnings was fastest in Satakunta at 6.4 per cent from the respective time period of the previous year. Earnings rose most slowly in Central Ostrobothnia where they went up by 1.5 per cent.
Monthly earnings of employees and pay differentials in the regions in 2009
| Region | Number | Total earnings, EUR / month | |||
| Mean | growth of earnings,% | Pay gap | Growth of pay gap, % | ||
| Total | 1 387 953 | 2 971 | 3,3 | 2,33 | -0,8 |
| 01 Uusimaa | 475 305 | 3 285 | 2,6 | 2,61 | -0,7 |
| 02 Varsinais-Suomi | 113 585 | 2 831 | 3,8 | 2,23 | 0,0 |
| 04 Satakunta | 56 776 | 2 852 | 6,4 | 2,17 | 0,8 |
| 05 Kanta-Häme | 40 786 | 2 737 | 3,1 | 2,10 | -1,0 |
| 06 Pirkanmaa | 124 740 | 2 873 | 3,0 | 2,23 | -1,0 |
| 07 Päijät-Häme | 46 848 | 2 754 | 4,6 | 2,12 | 0,3 |
| 08 Kymenlaakso | 41 897 | 2 794 | 1,6 | 2,12 | -1,9 |
| 09 South Karelia | 33 875 | 2 849 | 3,8 | 2,08 | -1,7 |
| 10 Etelä-Savo | 32 753 | 2 648 | 3,8 | 2,02 | -1,1 |
| 11 Pohjois-Savo | 57 331 | 2 764 | 4,1 | 2,12 | 0,4 |
| 12 North-Karelia | 36 707 | 2 661 | 3,2 | 2,00 | -0,5 |
| 13 Central Finland | 63 030 | 2 835 | 4,1 | 2,12 | -1,0 |
| 14 South Ostrobothnia | 40 187 | 2 666 | 3,6 | 2,06 | -0,8 |
| 15 Ostrobothnia | 40 545 | 2 902 | 3,9 | 2,16 | -0,5 |
| 16 Central Ostrobothnia | 14 965 | 2 691 | 1,5 | 2,10 | 0,0 |
| 17 North Ostrobothnia | 92 651 | 2 889 | 4,0 | 2,22 | -0,8 |
| 18 Kainuu | 16 487 | 2 699 | 4,2 | 2,01 | -1,3 |
| 19 Lapland | 39 602 | 2 771 | 3,4 | 2,07 | -0,7 |
| 20 Itä-Uusimaa | 17 791 | 2 926 | 4,2 | 2,26 | -2,4 |
In Satakunta, the rising of earnings was boosted by the rapid growth in the earnings of the highest paid wage and salary earner group, which is why the pay differential also grew there fastest among the regions during the exam-ined period. However, the pay differential in Satakunta was on level with the average for the country: the best paid decile of wage and salary earners earned at least 2.17 times more than the lowest earning decile.
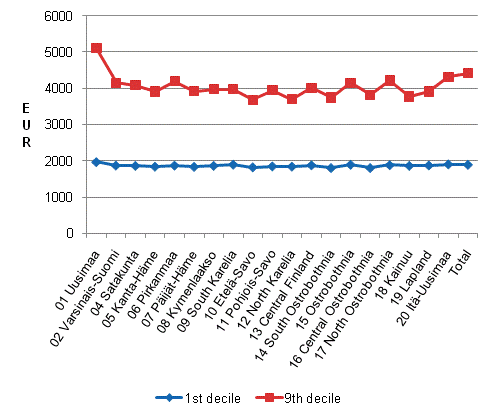
The pay differential between the highest and lowest earning wage and salary earners was the smallest in North Karelia and the largest in Uusimaa. The differentials in the dispersion of earnings between the regions are mostly caused by differences in the structures of their wage and salary earning populations and jobs. Most often, the pay differential arises from fluctua-tions in the level of the earnings of the best paid wage and salary earners. The level of pay for the lowest earning wage and salary earners was roughly equal in all regions whereas the level of pay for the highest earning decile varied considerably.
Figures on the dispersion of monthly earnings of employees in the regions in 2009

The earnings of the lowest paid decile were the highest in Uusimaa, where they amounted to EUR 1,953 at most, and the lowest in South Ostrobothnia at EUR 1,807 at most. Thus, the largest difference between the regions in the pay level of the lowest earning decile was EUR 168. The largest difference between the regions in the earnings of the best paid decile exceeded EUR 1,400. Thus, the difference was nearly ten-fold compared to the difference between the regions for the lowest earning decile.
Source: Structure of Earnings 2009, Statistics Finland
Inquiries: Mika Idman (09) 1734 3445, Jukka Pitkäjärvi (09) 1734 3445, palkkarakenne@stat.fi
Director in charge: Kari Molnar
Publication in pdf-format (304.0 kB)
- Reviews
- Tables
-
Tables in databases
Pick the data you need into tables, view the data as graphs, or download the data for your use.
Appendix tables
Updated 8.4.2011
Official Statistics of Finland (OSF):
Structure of Earnings [e-publication].
ISSN=1799-0092. 2009. Helsinki: Statistics Finland [referred: 19.4.2025].
Access method: http://stat.fi/til/pra/2009/pra_2009_2011-04-08_tie_001_en.html

