Published: 11 November 2011
Age has greatest impact on pay in demanding professional tasks
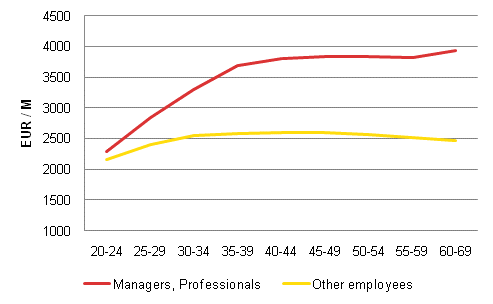
According to Statistics Finland's Structure of Earnings statistics, in 2010 age had the greatest impact on the pay of employees performing demanding professional tasks. The monthly salaries of professionals and associate professionals were the highest in the oldest age groups. No corresponding phenomenon could be observed among employees in less demanding positions. In these occupations, average earnings rose at the start of the working career but then failed to go up further after the age of 45 and in some cases the age-related development of pay could even take a negative turn.
Monthly earnings of employees by age in 2010

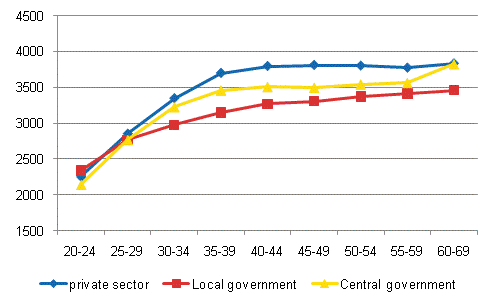
The employer sector had a significant influence on the phenomenon described above. In the public sector, development was relatively straightforward and earnings went up in the older age groups. In the private sector, again, it could be seen that the earnings of the oldest age groups no longer grow even in demanding occupations. The positive correlation between pay and age in the public sector can be explained by the way the careers of managers and professionals often develop; employees move to more demanding and better paid positions as they gain age and experience. In the private sector, high position and level of earnings is possibly reached at an earlier stage, meaning that the earnings of older age groups no longer develop significantly. On the other hand, employees in all best paid occupations may move to management positions or even to part-time retirement.
Monthly earnings of experts by age in 2010

The average monthly earnings of all full-time wage and salary earners amounted to EUR 3,043 in the last quarter of 2010. The average earnings of wage and salary earners in central government amounted to EUR 3,412, in the private sector to EUR 3,113 and in the local government sector to EUR 2,793. These differences in earnings result from, i.a., structural differences related to wage and salary earners and tasks in different employer sectors.
These data derive from Statistics Finland's Structure of Earnings statistics, which cover all employer sectors. Monthly earnings for total hours worked are only calculated for full-time wage and salary earners. Besides earnings for regular working hours, the earnings also include pay for any possible overtime and working hour supplements but not one-off performance-based bonuses.
Monthly earnings by major group of the Classification of Occupations and employer sector in 2010
| Clasiification of occupations | Total earnings, EUR/month | |||
| Total | Private sector | Local government | Central government | |
| 1 Legislators, senior officials and managers | 5 433 | 5 630 | 4 445 | 5 989 |
| 2 Professionals | 3 863 | 4 049 | 3 586 | 3 928 |
| 3 Technicians and associate professionals | 3 083 | 3 233 | 2 712 | 3 070 |
| 4 Clerks | 2 488 | 2 562 | 2 187 | 2 464 |
| 5 Service and care workers, and shop and market sales workers | 2 300 | 2 293 | 2 263 | 2 972 |
| 6 Skilled agricultural and fishery workers | 2 175 | 2 027 | 2 200 | 2 475 |
| 7 Craft and related trades workers | 2 746 | 2 760 | 2 469 | 2 641 |
| 8 Plant and machine operators and assemblers | 2 786 | 2 796 | 2 363 | 2 513 |
| 9 Elementary occupations | 2 126 | 2 200 | 1 975 | 2 101 |
| 0 Armed forces | 3 920 | - | - | 3 920 |
| Unknown | 3 249 | 2 871 | 2 971 | 3 850 |
Source: Structure of Earnings 2010, Statistics Finland
Inquiries: Mika Idman (09) 1734 3445, Jukka Pitkäjärvi (09) 1734 3356, palkkarakenne@stat.fi
Director in charge: Kari Molnar
Publication in pdf-format (238.3 kB)
- Tables
-
Tables in databases
Pick the data you need into tables, view the data as graphs, or download the data for your use.
Appendix tables
Updated 11.11.2011
Official Statistics of Finland (OSF):
Structure of Earnings [e-publication].
ISSN=1799-0092. 2010. Helsinki: Statistics Finland [referred: 19.4.2025].
Access method: http://stat.fi/til/pra/2010/pra_2010_2011-11-11_tie_001_en.html

