Pay differentials largest in Uusimaa, smallest in North Karelia
In 2010, average earnings were highest in Uusimaa at EUR 3,369. No other region achieved the level of average earnings for the whole country. The regions with the lowest earnings were Etelä-Savo (EUR 2,682) and South Ostrobothnia (EUR 2,695). In Uusimaa, the best paid decile earned at least 2.56 times more than the decile with the lowest earnings. North Karelia was the region with the smallest pay differential of only 2-fold between the deciles. The differentials in the dispersion of earnings between the regions are mostly caused by differences in the structures of their wage and salary earning populations and jobs.
Table 1. Average monthly earnings and dispersion of earnings of full-time wage and salary earners by region in 2010 by Region and Total earnings, EUR / month
| Region | Total earnings, EUR / month | ||||
| Number | Mean | 1st decile | Median | 9th decile | |
| Total | 1 394 260 | 3 040 | 1 937 | 2 715 | 4 498 |
| 01. Uusimaa | 475 916 | 3 369 | 2 023 | 2 977 | 5 174 |
| 02. Varsinais-Suomi | 113 975 | 2 904 | 1 901 | 2 618 | 4 233 |
| 04. Satakunta | 53 885 | 2 849 | 1 887 | 2 592 | 4 045 |
| 05. Kanta-Häme | 44 064 | 2 820 | 1 899 | 2 585 | 4 013 |
| 06. Pirkanmaa | 124 838 | 2 926 | 1 909 | 2 653 | 4 246 |
| 07. Päijät-Häme | 47 319 | 2 802 | 1 881 | 2 564 | 3 954 |
| 08. Kymenlaakso | 41 445 | 2 912 | 1 922 | 2 649 | 4 161 |
| 09. South Karelia | 30 555 | 2 884 | 1 912 | 2 692 | 3 996 |
| 10. Etelä-Savo | 32 239 | 2 692 | 1 833 | 2 482 | 3 745 |
| 11. Pohjois-Savo | 57 173 | 2 820 | 1 886 | 2 580 | 4 000 |
| 12. North Karelia | 38 928 | 2 736 | 1 891 | 2 521 | 3 809 |
| 13. Central Finland | 66 092 | 2 959 | 1 931 | 2 679 | 4 275 |
| 14. South Ostrobothnia | 41 923 | 2 694 | 1 842 | 2 473 | 3 749 |
| 15. Ostrobothnia | 39 439 | 2 931 | 1 933 | 2 666 | 4 190 |
| 16. Central Ostrobothnia | 15 662 | 2 844 | 1 902 | 2 624 | 4 020 |
| 17. North Ostrobothnia | 90 620 | 2 947 | 1 923 | 2 680 | 4 262 |
| 18. Kainuu | 20 372 | 2 846 | 1 939 | 2 582 | 4 094 |
| 19. Lapland | 40 901 | 2 813 | 1 902 | 2 592 | 3 947 |
| 20. Itä-Uusimaa | 17 048 | 2 990 | 1 947 | 2 751 | 4 336 |
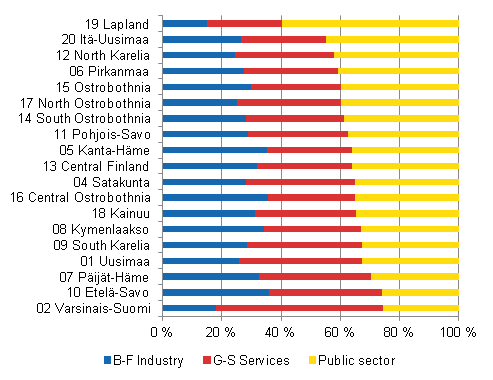
At the end of 2010, more than one-third of all full-time wage and salary earners were located in the region of Uusimaa. The share employed by the public sector was highest in Lapland and Itä-Uusimaa. By contrast, the share of wage and salary earners employed by the private sector was significant in Varsinais-Suomi and Etelä–Savo and, due to a large share of service industries, also in Uusimaa and South Karelia.
Figure 1. Shares of employer sectors of employment relationships recorded in statistics in different regions in 2010, % of full-time wage and salary earners in region

Source: Structure of Earnings 2010, Statistics Finland
Inquiries: Mika Idman 09 1734 3445, Jukka Pitkäjärvi 09 1734 3356, palkkarakenne@stat.fi
Director in charge: Kari Molnar
Updated 5.4.2012
Official Statistics of Finland (OSF):
Structure of Earnings [e-publication].
ISSN=1799-0092. 2010,
Pay differentials largest in Uusimaa, smallest in North Karelia
. Helsinki: Statistics Finland [referred: 19.4.2025].
Access method: http://stat.fi/til/pra/2010/pra_2010_2012-04-05_kat_001_en.html

