Published: 19 October 2012
Average total monthly earnings of wage and salary earners EUR 3,111 in 2011
According to Statistics Finland’s Structure of Earnings statistics, in the last quarter of 2011 the average monthly earnings of all full-time wage and salary earners were EUR 3,111 and the median earnings EUR 2,776. The average hourly earnings of wage and salary earners were EUR 18.35 and the median earnings EUR 16.17. Very high earnings have a lower impact on median earnings than on average earnings and the figure thus describes better the level of earnings of an average wage and salary earner.
Wage and salary earners were best paid in the central government sector where their hourly earnings were EUR 21. 65. In the private sector the average hourly earnings were EUR 18.70 and in the local government sector EUR 16.84. The high level of earnings in the central government sector is explained by the structure of its employees. The central government is a small employer sector and the tasks of its employees are mainly those of experts. An examination by occupational group improves the comparability of the level of earnings between the sectors. In several occupational groups the employees in the private sector are the best paid. Local government employees are the worst paid in all occupational groups.
Monthly earnings by major group of the Classification of Occupations and employer sector in 2011
| Classification of occupations | Total earnings, EUR/hour | |||
| Total | Private sector | Central government | Local government | |
| Total | 18,35 | 18,70 | 21,65 | 16,84 |
| 1 Legislators, senior officials and managers | 34,67 | 35,67 1) | 38,57 | 29,67 |
| 2 Professionals | 24,63 | 26,17 | 25,50 | 22,04 |
| 3 Technicians and associate professionals | 19,15 | 20,22 | 19,67 | 16,58 |
| 4 Clerks | 15,47 | 15,74 | 16,07 | 13,92 |
| 5 Service and care workers, and shop and market sales workers | 13,79 | 13,72 | 18,60 | 13,62 |
| 6 Skilled agricultural and fishery workers | 13,28 | 12,10 | 15,87 | 13,43 |
| 7 Craft and related trades workers | 16,75 | 16,85 | 16,92 | 14,59 |
| 8 Plant and machine operators and assemblers | 16,66 | 16,73 | 15,95 | 13,78 |
| 9 Elementary occupations | 12,46 | 12,67 | 13,43 | 11,91 |
| 0 Armed forces | 22,45 | – | 22,45 | – |
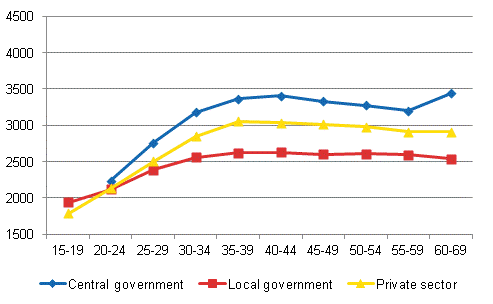
In a comparison by age group, the group of 40 to 44-year-olds is the best paid, on the average, in all employer sectors when the monthly earnings of full-time employees are compared. It should also be noted that the age group in question is the turning point after which earnings start to decline in all age groups on the average. The earnings of those on the threshold of retirement age only seem to rise sharply in the central government sector.
Monthly median earnings of employees by age in 2011

These data derive from Statistics Finland’s Structure of Earnings statistics, which cover all employer sectors. Monthly earnings for total hours worked are only calculated for full-time wage and salary earners. Besides earnings for regular working hours, the earnings also include pay for any possible overtime and working hour supplements but not one-off performance-based bonuses.
Source: Structure of Earnings 2011, Statistics Finland
Inquiries: Mika Idman 09 1734 3445, Jukka Pitkäjärvi 09 1734 3356, palkkarakenne@stat.fi
Director in charge: Kari Molnar
Publication in pdf-format (242.4 kB)
- Reviews
- Tables
-
Tables in databases
Pick the data you need into tables, view the data as graphs, or download the data for your use.
Appendix tables
Updated 19.10.2012
Official Statistics of Finland (OSF):
Structure of Earnings [e-publication].
ISSN=1799-0092. 2011. Helsinki: Statistics Finland [referred: 19.4.2025].
Access method: http://stat.fi/til/pra/2011/pra_2011_2012-10-19_tie_001_en.html

