Published: 5 April 2013
Average pay of those with lower university level degrees has contracted compared to other levels of education in the 2000s
Corrected on 7 May 2013. The correction is
indicated in red. Was previously EUR 3,108.
According to Statistics Finland’s Structure of Earnings
statistics, in the last quarter of 2011 the average monthly
earnings of all full-time wage and salary earners were EUR
3,109 and the median earnings EUR
2,774. Divided by level of education, those with the lowest level
tertiary qualifications were closest to the average monthly
earnings for the whole country, with average monthly earnings of
EUR 3,177. In lower levels of education than this, the average
income was lower than the average for the whole country and in
higher levels of education the income was in turn higher.
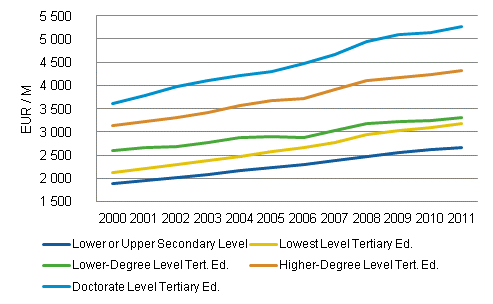
Development of average monthly pay of full-time wage and salary earners in 2000s by levels of education

The monthly earnings of full-time wage and salary earners have developed fairly evenly in the 2000s apart from those with lower university level degrees. The nominal monthly earnings of this group grew only by 27 per cent between 2000 and 2011 and the average pay of the group fell close to the level of those with lowest degree level tertiary education. The small growth percentage is explained by the increase in wage and salary earners with lower university level degrees and their placement in jobs with lower competence requirements than before. Lower-degree level tertiary education comprises, for instance, polytechnic degrees and lower university degrees.
In other levels of education, average monthly earnings grew by nearly forty per cent between 2000 and 2011. The biggest growth was seen among those with lowest degree level tertiary education, 49 per cent. Wage and salary earners with doctorate level degrees earned on average EUR 5,256 per month in 2011, which is approximately twice as much as the average pay of those with lower secondary education. This ratio has remained nearly unchanged throughout the 2000s.
Average monthly pay of full-time wage and salary earners and dispersion of earnings by levels of education in 2011
| Educational level | Total earnings, EUR / month | ||||
| Mean | 1st decile | Median | 9th decile | Change in earnings 2000-2011, % | |
| Lower Secondary Education | 2 605 | 1 760 | 2 405 | 3 638 | 40,7 |
| Upper Secondary Level Ed. | 2 681 | 1 887 | 2 500 | 3 681 | 40,7 |
| Lowest Level Tertiary Ed. | 3 177 | 2 188 | 2 895 | 4 500 | 48,8 |
| Lower-Degree Level Tert. Ed. | 3 302 | 2 200 | 3 020 | 4 764 | 26,7 |
| Higher-Degree Level Tert. Ed. | 4 328 | 2 720 | 3 900 | 6 446 | 38,0 |
| Doctorate Level Tertiary Ed. | 5 256 | 3 314 | 4 721 | 7 636 | 45,6 |
| Total | 3 109 | 1 972 | 2 774 | 4 602 | 46,0 |
These data derive from Statistics Finland’s Structure of Earnings statistics, which cover all employer sectors. Monthly earnings for total hours worked are only calculated for full-time wage and salary earners. Besides earnings for regular working hours, the earnings also include pay for any possible overtime and working hour supplements but not one-off performance-based bonuses.
Source: Structure of Earnings 2011, Statistics Finland
Inquiries: Sampo Pehkonen 09 1734 3452, Mika Idman 09 1734 3445, palkkarakenne@stat.fi
Director in charge: Hannele Orjala
Publication in pdf-format (273.7 kB)
- Reviews
- Tables
-
Tables in databases
Pick the data you need into tables, view the data as graphs, or download the data for your use.
Appendix tables
Updated 7.5.2013
Official Statistics of Finland (OSF):
Structure of Earnings [e-publication].
ISSN=1799-0092. 2011. Helsinki: Statistics Finland [referred: 19.4.2025].
Access method: http://stat.fi/til/pra/2011/pra_2011_2013-04-05_tie_001_en.html

