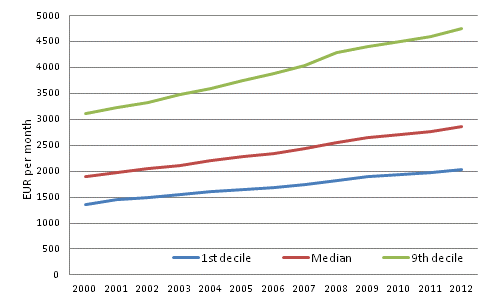
Nominal median earnings of full-time wage and salary earners have risen by 50 per cent in the 2000s
According to Statistics Finland's Structure of Earnings statistics, the median of total earnings of full-time wage and salary earners was EUR 2,853 in 2012. The corresponding median earnings in 2000 were EUR 1,904. Nominal median earnings have thus risen by 50 per cent over the 2000s. In real terms, that is, when account is taken of the risen price level, median earnings rose by 21 per cent over the corresponding period. One-half of full-time wage and salary earners earn more than median earnings and one half less.Figure 1. 1st decile, median and 9th decile of total earnings of full-time wage and salary earners in 2000 to 2012

The highest earning decile of full-time wage and salary earners earned at least EUR 4,756 in 2012. This is 53 per cent more than in 2000. The lowest earning decile earned EUR 2,027 or less in 2012, which is 48 per cent more than in 2000.
Because the earnings of the highest decile have grown faster than those of the lowest decile, the difference in earnings has grown between the upper and lower end of the pay distribution over the 2000s. The highest earning decile in 2012 earned at least 2.35 times more than that earned by the lowest earning decile. The corresponding figure in 2000 was 2.28.
Although real wages and salaries have increased in all decile categories from 2000 to 2012, the growth has taken place over the period 2000 to 2008. When the change in real wages and salaries is examined between 2009 to 2012, it can be seen that real wages and salaries have fallen slightly in the lowest income deciles and risen by a couple of tenths of a per cent in the highest income deciles.
Changes in decile and median earnings are caused by the growth in the earnings of wage and salary earners and by a structural change which makes jobs disappear and creates them.
Table 1. Percentage change of nominal and real earnings by decile in 2000 to 2012 and 2009 and 2012
| EUR per month, year 2012 | Nominal change 2000–2012 | Real change 2000–2012 | Nominal change 2009–2012 | Real change 2009–2012 | |
| 1st decile | 2 027 | 48,2 | 19,4 | 7,1 | -0,5 |
| 2nd decile | 2 250 | 48,2 | 19,4 | 7,1 | -0,5 |
| 3rd decile | 2 444 | 49,6 | 20,5 | 7,6 | -0,1 |
| 4th decile | 2 632 | 49,3 | 20,3 | 7,6 | -0,1 |
| 5th decile (median) | 2 853 | 49,9 | 20,7 | 7,9 | 0,2 |
| 6th decile | 3 114 | 50,3 | 21,1 | 7,9 | 0,2 |
| 7th decile | 3 453 | 51,0 | 21,7 | 8,4 | 0,6 |
| 8th decile | 3 920 | 51,2 | 21,8 | 8,2 | 0,5 |
| 9th decile | 4 756 | 52,7 | 23,1 | 7,9 | 0,2 |
Source: Structure of Earnings 2012, Statistics Finland
Inquiries: Sampo Pehkonen 09 1734 3452, Jukka Pitkäjärvi 09 1734 3356, palkkarakenne@stat.fi
Director in charge: Hannele Orjala
Updated 8.4.2014
Official Statistics of Finland (OSF):
Structure of Earnings [e-publication].
ISSN=1799-0092. 2012,
Nominal median earnings of full-time wage and salary earners have risen by 50 per cent in the 2000s
. Helsinki: Statistics Finland [referred: 26.4.2025].
Access method: http://stat.fi/til/pra/2012/pra_2012_2014-04-08_kat_001_en.html

