Published: 14 October 2014
Median monthly earnings of wage and salary earners were EUR 2,928 per month in 2013
According to Statistics Finland’s Structure of Earnings statistics, the median of total earnings of full-time wage and salary earners was EUR 2,928 in October 2013. The average for total earnings was EUR 3,284. Besides earnings for regular working hours, total earnings also include all bonuses and benefits in kind but not one-off pay items, such as performance-based bonuses.
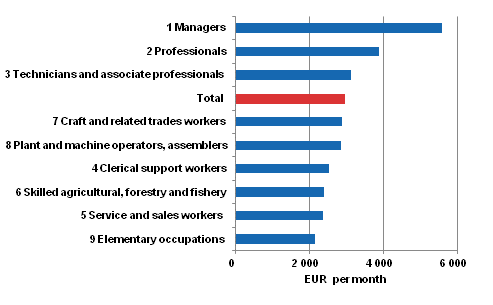
Median of total earnings of full-time wage and salary earners by occupation group (Classification of Occupations 2010) in 2013

When viewing the median of total earnings of full-time wage and salary earners by main occupational group, managers 1) stand out from other occupational groups with the highest median earnings (EUR 5,580). Professionals had the second highest median earnings, EUR 3,873.
The median earnings of craft and related trades workers and plant and machine operators, and assemblers are nearly the same, EUR 2,864 and EUR 2,840 respectively. Service and sales workers and elementary occupations had the lowest median earnings. Of full-time service and sales workers, one-half earned less than EUR 2,352 per month.
Largest variation in the earnings of managers
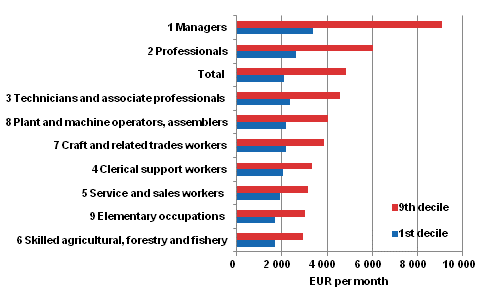
The earnings of full-time wage and salary earners vary within occupations and between occupational groups. The biggest variation within an occupational group was among managers. Ten per cent of managers earned less than EUR 3,381, and ten per cent of managers earned more than EUR 9,094; the difference between the first and ninth deciles was nearly triple.
In other occupational groups, the variation between total earnings was smaller. Depending on the occupational group total earnings were 1.6 to 2.3 times higher in the highest decile compared with the first decile. In general, the difference between total earnings in the first and ninth deciles was the higher, the higher the median earnings of the occupational group were.
Total earnings of full-time wage and salary earners in the first and ninth deciles by occupational group (Classification of Occupations 2010) in 2013

The differences between the occupational groups in the lower end of the pay distribution (1st decile) were smaller than in the upper end of the pay distribution (9th decile). In most occupational groups, ten per cent of wage and salary earners earned less than EUR 2,200. The earnings were lowest in the occupational group elementary occupations, where ten per cent of full-time wage and salary earners earned under EUR 1,693 per month. The occupational group elementary occupations consists of cleaners and helpers working in different fields.
The dispersion in total earnings grew between occupational groups in the ninth decile. The 9th decile of service and sales workers was around EUR 3,000 while ten per cent of plant and machine operators. and assemblers earned over EUR 4,000 per month. Ten per cent of managers earned over EUR 9,000 per month.
Bonuses boost total earnings
Different types of bonuses form a considerable share of earnings especially in the higher deciles. In 2013, the amount of benefits in kind for managers in the highest decile was, on average, EUR 600 per month. For professionals and technicians and associate professionals the importance of benefits in kind was smaller.
Compensations for shift work and overtime compensations considerably increase total earnings in the highest decile of service and sales workers, craft and related trades workers, as well as plant and machine operators, and assemblers. Compensations for shift work and overtime compensations formed 21 per cent of the total earnings in the highest decile of plant and machine operators, and assemblers. The corresponding figure for service and sales workers was 13 per cent.
Apart from earnings for regular working hours, total earnings also include pay for any possible overtime and working hour supplements, premium pays, supplement for location and adverse working conditions, supplements based on duties, professional skill and years of service, performance-based pay components, compensation for standby and on-call work and benefits in kind, but not one-off pay items, such as performance-based bonuses.
1) The structure of earnings statistics do not include the top management of enterprises.
Source: Structure of Earnings 2013, Statistics Finland
Inquiries: Sampo Pehkonen 029 551 3452, Jukka Pitkäjärvi 029 551 3356, palkkarakenne@stat.fi
Director in charge: Hannele Orjala
Publication in pdf-format (251.5 kB)
- Reviews
- Tables
-
Tables in databases
Pick the data you need into tables, view the data as graphs, or download the data for your use.
Appendix tables
Updated 14.10.2014
Official Statistics of Finland (OSF):
Structure of Earnings [e-publication].
ISSN=1799-0092. 2013. Helsinki: Statistics Finland [referred: 19.4.2025].
Access method: http://stat.fi/til/pra/2013/pra_2013_2014-10-14_tie_001_en.html

