Published: 14 October 2015
Premium pay paid to one-third of wage and salary earners
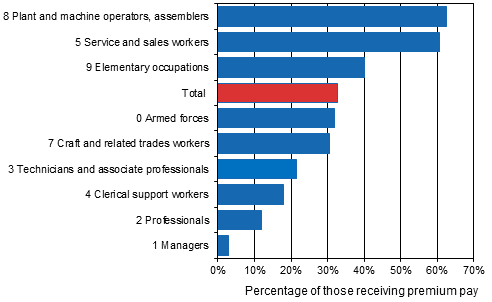
According to Statistics Finland's Structure of Earnings statistics, one-third of wage and salary earners received bonuses related to working time in 2014. Premium pay is most common for plant and machine operators, and assemblers. Premium pay was paid less often to technicians and associate professionals and clerical workers. Premium pay includes compensations for shift, evening, night, Saturday and Sunday work.
Share of those having earned premium pay in the statistical reference period among all wage and salary earners by occupational category (Classification of Occupations 2010) in 2014

The average of wage and salary earners' total earnings was EUR 19.4 per hour in 2014. Besides earnings for regular working hours, total earnings also include all bonuses, overtime pay and benefits in kind, but not one-off pay items, such as performance-based bonuses.
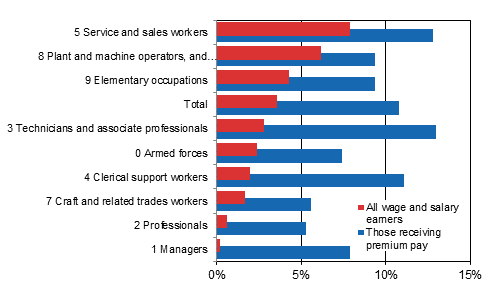
The share of premium pay in total earnings per hour worked was 3.6 per cent, on average, for all wage and salary earners. For wage and salary earners having received bonuses, premium pay formed 10.8 per cent of total earnings.
For instance, premium pay formed an average of eight per cent of total earnings of all service and sales workers. On average, bonuses accounted for 13 per cent of the earnings of those service and sales workers to whom premium pay was paid.
Share of premium pay in total earnings by occupational category (Classification of Occupations 2010) in 2014

Premium pay formed a substantial share of total earnings of plant and machine operators, and assemblers and of elementary occupations. Premium pay is less significant for technicians and associate professionals' occupations, but among those who received premium pay, it formed 12 per cent of total earnings, on average.
Among technicians and associate professionals, premium pay was paid to midwives, nurses, and customs and border inspectors, for example. All in all, premium pay constituted 17.0 per cent of midwives' earnings, on average. If the examination is limited only to those midwives to whom bonuses were paid, the average share of premium pay in total earnings was 20.6 per cent.
Other occupational categories where premium pay formed, on average, over ten per cent of all wage and salary earners' total earnings per hour worked, were such as police officers, prison guards and security guards, service station attendants, bartenders, waiters, hotel receptionists, paper industry machine operators, and mining and quarrying labourers.
Premium pay is not part of remuneration in several professional occupations, such as lawyers, finance professionals, architects or researchers. Estate agents or sales representative do not receive bonuses either. Their pay is mainly based on commissions. There are also occupational categories in construction, such as upholsterers and plasterers, for whom premium pay has an extremely small significance in the formation of their earnings.
Overtime pay most common for the armed forces and for plant and machine operators, and assemblers
During the statistical reference period, overtime work formed a relatively small share of all wage and salary earners' total earnings, 1.2 per cent, on average. Seventeen per cent of wage and salary earners received overtime compensations. For them, overtime pay formed 6.9 per cent of total earnings.
Overtime compensations were paid most often to the armed forces and to plant and machine operators, and assemblers, and to craft and related trades workers.
The preliminary Structure of Earnings statistics for 2014 describe the earnings of around 1.6 million wage and salary earners. The data in the statistics are collected from monthly-paid wage and salary earners for September, October or November and from hourly-paid wage and salary earners for the last quarter of the year.
Total earnings per hour worked are defined for monthly-paid wage and salary earners by dividing the monthly pay by regular weekly working hours raised to the monthly level. For hourly-paid employees, total earnings for hour worked are based on hours worked and on earnings paid for them.
Number of wage and salary earners and share of overtime earnings in total earnings per hour worked by occupational category (Classification of Occupations 2010) in 2014
| Classification of Occupations 2010 | All wage and salary earners | Those received overtime earnings | |||
| Number | Total earnings per hour, EUR | Overtime earnings in total earnings, percentage | Number | Overtime earnings in total earnings, percentage | |
| 1 Managers | 50 532 | 37.4 | 0.2 | 1 050 | 11.0 |
| 2 Professionals | 324 090 | 26.1 | 0.6 | 22 874 | 8.6 |
| 3 Technicians and associate professionals | 358 611 | 20.1 | 1.0 | 50 050 | 6.9 |
| 4 Clerical support workers | 125 278 | 16.2 | 1.0 | 17 368 | 7.2 |
| 5 Service and sales workers | 356 689 | 14.7 | 0.7 | 51 849 | 5.1 |
| 6 Skilled agricultural, forestry and fishery workers | 7 033 | 14.2 | 1.3 | 1 642 | 5.5 |
| 7 Craft and related trades workers | 144 992 | 17.6 | 2.4 | 45 728 | 7.6 |
| 8 Plant and machine operators, and assemblers | 125 142 | 17.9 | 3.3 | 56 972 | 7.2 |
| 9 Elementary occupations | 116 131 | 13.2 | 1.4 | 23 796 | 6.6 |
| 0 Armed forces | 7 814 | 26.0 | 2.4 | 3 921 | 4.8 |
| X Unknown | 6 232 | 17.5 | 1.5 | 774 | 11.7 |
| Total | 1 622 544 | 19.4 | 1.2 | 276 025 | 6.9 |
The average for total earnings of full-time wage and salary earners per month was EUR 3,308 in 2014. The median for total earnings was EUR 2,946. The database tables of the Structure of Earnings statistics contain data on wage and salary earners' monthly earnings according to the Classification of Occupations 2010, age group and educational level.
Apart from earnings for regular working hours, total earnings also include pay for any possible overtime and working hour supplements, premium pays, supplement for location and adverse working conditions, supplements based on duties, professional skill and years of service, performance-based pay components, compensation for standby and on-call work, pay paid for hours not worked and benefits in kind. Total earnings do not include one-off pay items, such as performance-based bonuses.
Source: Structure of Earnings 2014, Statistics Finland
Inquiries: Sampo Pehkonen 029 551 3452, Jukka Pitkäjärvi 029 551 3356, palkkarakenne@stat.fi
Director in charge: Mari Ylä-Jarkko
Publication in pdf-format (226.2 kB)
- Tables
-
Tables in databases
Pick the data you need into tables, view the data as graphs, or download the data for your use.
Appendix tables
Updated 14.10.2015
Official Statistics of Finland (OSF):
Structure of Earnings [e-publication].
ISSN=1799-0092. 2014. Helsinki: Statistics Finland [referred: 26.4.2025].
Access method: http://stat.fi/til/pra/2014/pra_2014_2015-10-14_tie_001_en.html

