Published: 12 December 2019
Share of compensation of employees in production value highest in repair and installation of machinery and equipment of all manufacturing industries in 2015
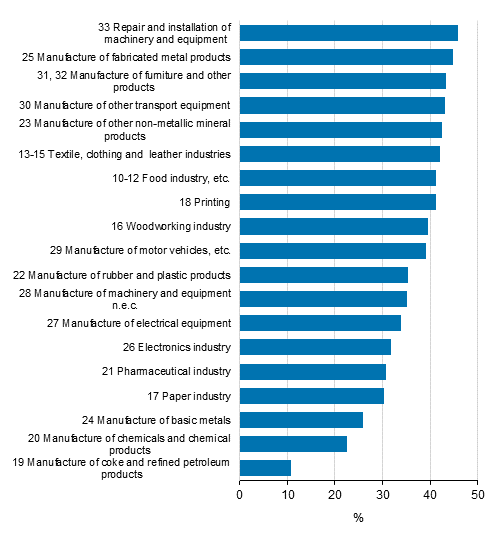
According to Statistics Finland’s input-output statistics, the share of compensation of employees in production value was highest in repair and installation of machinery and equipment of all manufacturing industries in 2015. In total, 45.8 per cent of the production value of the industry was made up of compensation of employees, i.e. wages and salaries and employer’s social security contributions, when direct and indirect compensation of employees used in the production are taken into account. Oil refining had the lowest share of compensation of employees of output, 10.8 per cent. The share of import inputs was highest in the same industry, 72.1 per cent.
The share of compensation of employees in production value in manufacturing in 2015

The shares of compensation of employees are based on the “expense components of output at basic prices” table of the input-output statistics. In the table, the output at basic prices that describe the values of the industries’ production have been divided into expense components, that is, the use of imported products included in the output at basic prices, taxes on products minus subsidies, wages and salaries, employer's social security contributions, other taxes on production minus other subsidies on production, consumption of fixed capital and operating surplus, net.
In the “Expense components of output at basic prices” table, the direct and indirect compensation of employees used in the production are taken into account in the shares of wages and salaries and employer’s social security contributions, i.e. compensation of employees. Direct compensation of employees comprise the industry’s own compensation of employees. Indirect compensation of employees comprise compensation of employees included in the manufacturing of domestic products bought from other industries.
On the level of the whole economy, the share of compensation of employees was 42.5 per cent, the share of import inputs 20.9 per cent, the share of operating surplus 18.7 per cent and the share of consumption of fixed capital 15.8 per cent. The share of indirect taxes (minus received subsidies) was 2.0 per cent.
Statistics Finland publishes annually the supply and use tables describing product flows in the national economy, and the input-output and analysis tables derived from them. The data published now concern the year 2015, and they are consistent with the time series revised data on national accounts published in September 2019. Thus, the data deviate from the data on 2015 published in December 2018. Tables concerning 2016 will be published in April 2020.
Source: Input-output 2015, Statistics Finland.
Inquiries: Markku Räty 029 551 2647, Ville Lindroos 029 551 3323, Merja Myllymäki 029 551 3533, kansantalous@stat.fi
Director in charge: Ville Vertanen
Publication in pdf-format (168.6 kB)
- Tables
-
Tables in databases
Pick the data you need into tables, view the data as graphs, or download the data for your use.
Updated 12.12.2019
Official Statistics of Finland (OSF):
Input-output [e-publication].
ISSN=1799-201X. 2015. Helsinki: Statistics Finland [referred: 19.4.2025].
Access method: http://stat.fi/til/pt/2015/pt_2015_2019-12-12_tie_001_en.html

