Published: 29 April 2021
Prices of import inputs rose more than prices of domestic inputs in 2018
According to Statistics Finland's input-output statistics, prices of intermediate consumption rose in all industries by 3.2 per cent in 2018. The prices of inputs acquired from the domestic market went up by 2.6 per cent, while the prices of inputs imported from abroad rose by 4.5 per cent. Thus, imports of inputs, on average, had a raising effect on the price change of intermediate consumption in the industry.
Intermediate consumption consists of the value of products and services consumed as inputs in production processes, excluding fixed assets, whose consumption is recorded as consumption of fixed capital. Goods and services can either be converted or utilised in the production process. Around 30 per cent of all inputs are imported from abroad.
Imports of inputs have the biggest impact in the industries where a majority of intermediate products are imported from abroad and where the prices of intermediate products imported from abroad have developed differently from domestic market inputs.
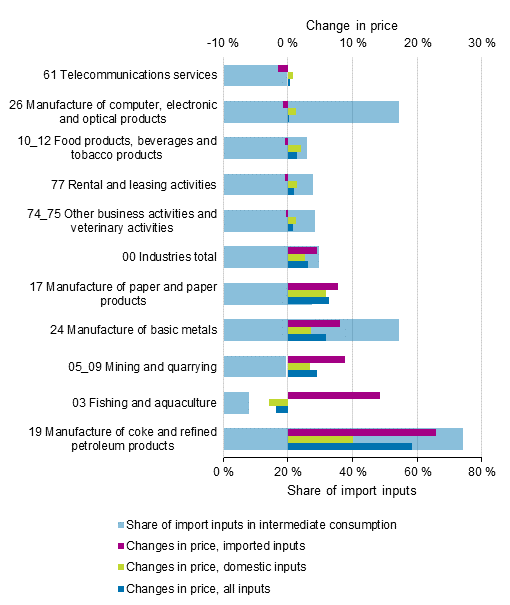
The price impact of imports on enterprises’ intermediate consumption was biggest in industry 19 Manufacture of coke and refined petroleum products. This was affected by that the import share of the industry’s inputs was bigger than average, 74 per cent, and the 23 per cent rise in import prices was bigger than the 10 per cent rise in the prices of domestic inputs.
Changes in price and shares of import inputs in industries' intermediate consumption

The use of imported inputs curbed the price change in enterprises’ intermediate consumption, especially in industry 26 Manufacture of computer, electronic and optical products. In this industry, the prices of import inputs went down by around one per cent from the previous year, while the prices of domestic inputs went up by the same amount. While the share of import inputs was 54 per cent of all inputs in the industry, the fallen import prices kept the price change of intermediate products in the industry at zero, on average.
In addition to industry 19 Manufacture of coke and refined petroleum products, prices of import inputs increased significantly in industries 03 Fishing and aquaculture (+14%), 05_09 Mining and quarrying (+9%), 24 Manufacture of basic metals (+8%) and 17 Manufacture of paper and paper products (+8%).
The prices of import inputs fell in 2018 only in a few industries. The biggest drop was recorded in industry 61 Telecommunications, where the prices of import inputs fell by 1.5 per cent from the previous year.
Statistics Finland publishes annually the supply and use tables describing product flows in the national economy, and the input-output and analysis tables derived from them. The data published now concern the year 2018. Tables concerning 2019 will be published in November 2021.
Source: Input-output 2018, Statistics Finland.
Inquiries: Markku Räty 029 551 2647, Ville Lindroos 029 551 3323, kansantalous@stat.fi
Head of Department in charge: Katri Kaaja
Publication in pdf-format (171.7 kB)
- Tables
-
Tables in databases
Pick the data you need into tables, view the data as graphs, or download the data for your use.
Updated 29.4.2021
Official Statistics of Finland (OSF):
Input-output [e-publication].
ISSN=1799-201X. 2018. Helsinki: Statistics Finland [referred: 10.3.2025].
Access method: http://stat.fi/til/pt/2018/pt_2018_2021-04-29_tie_001_en.html

