This set of statistics has been discontinued.
Statistical data on this topic are published in connection with another set of statistics.
Data published after 5 April 2022 can be found on the renewed website.
Published: 27 May 2016
Exports of services grew strongly in 2015
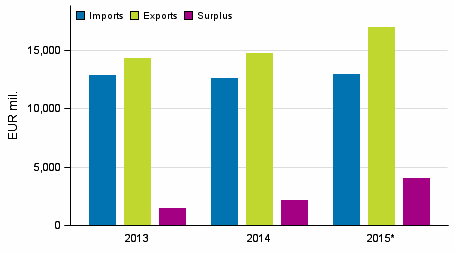
According to Statistics Finland's preliminary data, exports of services grew by over EUR two billion in 2015 compared to the previous year. As the level of imports rose only slightly, the surplus of international trade in services grew to over EUR four billion. Exports of services grew in all service items except for postal and courier services. Exports increased most in construction and project deliveries, and computer and information services.
Service imports, exports and surplus in 2013 to 2015*, EUR million

Exports of services grew by 15 per cent in 2015 compared with the previous year. The value of service exports totalled EUR 16.9 billion. Imports of services grew by three per cent to EUR 12.9 billion. Thus, the surplus of service trade nearly doubled in one year. The net sales of goods processed abroad and of merchanting also went down in that year by nearly EUR one billion from the year before. The value derived from the item concerned was EUR 0.9 billion in 2015, while two years earlier, it was EUR 2.8 billion.
Sales margin from goods manufactured abroad in 2013 to 2015*, EUR million (the table was corrected on 10 July 2016)
| Item | 2013 | 2014 | 2015* |
| Net sales of goods processed abroad and of merchanting | 2 810 | 1 868 1) | 930 |
Computer and information services are exported from Finland
Exports of computer and information services cover over 40 per cent of service exports. Exports of computer and information services and construction and project deliveries grew significantly compared with the previous year. The structure of exports remained more or less unchanged as the share of construction and project deliveries grew slightly
The biggest import items were computer and information services, advertising, market research and public opinion polling, trade-related services and unclassified business services. Imports of unclassified business services grew significantly from the year before.
Service exports and imports biggest from the EU area
One-half of service exports were directed to EU countries, whose share, however, went down by six percentage points, while the share of Asia grew by four percentage points to 20 per cent. Examined by area, imports of services were more centred than exports, the share of EU countries being nearly 70 per cent. In service imports, the shares of different areas remained unchanged from the previous years
Examined by area, the main trade partners have remained unchanged from the year before. Services are exported most to Sweden, the United States, Luxembourg, the United Kingdom and Germany. The growth in the share of Asia is explained by increased exports to China and South Korea. China went past Japan as the most significant trade partner in Asia in service exports. The main trade partners in imports are Sweden, the United States, Germany and the United Kingdom.
Differences in regional divisions of services
In all service items at least one-half of imports come from EU countries. In manufacturing services and construction and project deliveries, over 90 per cent of imports come from the EU area. Imports of other business services, royalties and licence fees, maintenance and repair services and postal and courier services were more divided by area compared with other service items.
Exports of services were more dispersed by area than imports. When nearly all imports of construction and project deliveries derive from EU countries, their exports are evenly divided around the world. Only manufacturing services are imported almost exclusively to the area of Europe. Most royalties and licence fees derive from Asia. America also has a bigger share of royalties and licence fees than Europe.
Source: Foreign trade in services 2015, Statistics Finland
Inquiries: Risto Sippola 029 551 3383, Ari Knuuti 029 551 3344, globalisaatio.tilastot@stat.fi
Director in charge: Mari Ylä-Jarkko
Publication in pdf-format (208.0 kB)
- Tables
-
Tables in databases
Pick the data you need into tables, view the data as graphs, or download the data for your use.
Appendix tables
Updated 27.5.2016
Statistics:
International trade in services [e-publication].
ISSN=1798-3525. 2015. Helsinki: Statistics Finland [referred: 19.4.2025].
Access method: http://stat.fi/til/pul/2015/pul_2015_2016-05-27_tie_001_en.html

