Published: 15 July 2010
Households invested in shares and funds last year
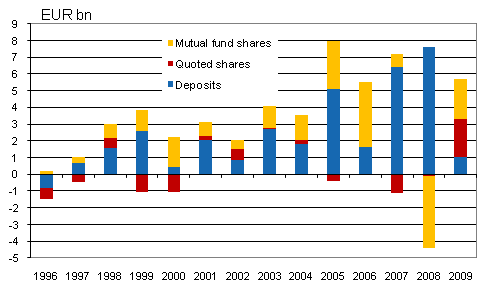
The strong growth of households’ deposits came to a halt in 2009. Instead of deposits, households invested in shares and funds, directing EUR 3.6 billion worth of their financial assets to them. Their investments in quoted shares amounted to good EUR 2 billion, or more than ever before. Thanks to holding gains, households’ financial assets grew to a total of EUR 201 billion over the year. These data derive from Statistics Finland’s Financial Accounts statistics.
Households' net acquisition of mutual fund shares, quoted shares and deposits

Households’ financial wealth grew
Households’ financial assets grew by nearly EUR 15 billion during 2009. More than one-half of the growth came from holding gains. At the same time households’ debts grew by EUR 4 billion, or by the least amount since 2001. Thus, their net financial assets, i.e. difference between financial assets and liabilities, grew by nearly EUR 11 billion. Household indebtedness ratio, i.e. proportion of loans relative to disposable income, rose to 112.4 per cent.
Releasing of quarterly data will begin in January
The compilation of quarterly financial accounts will be transferred to Statistics Finland from the Bank of Finland. Quarterly statistics provide a timely description about developments in the financial assets and liabilities of all sectors of the national economy. Statistics Finland will begin to release the quarterly data in January 2011 and these will then relate to the third quarter of 2010. Annual financial accounts data will next be released in July 2011.
Source: Financial Accounts, Statistics Finland
Inquiries: Matti Okko +358-9-1734 3341, Marjatta Ropponen +358-9-1734 3323, rahoitus.tilinpito@stat.fi
Director in charge: Ari Tyrkkö
Publication in pdf-format (355.5 kB)
- Reviews
-
- 1. Households financial wealth increased in 2009 (15.7.2010)
- Tables
-
Tables in databases
Pick the data you need into tables, view the data as graphs, or download the data for your use.
Appendix tables
- Appendix table 1. Financial assets of households, million EUR (15.7.2010)
- Appendix table 2. Liabilities of households, million EUR (15.7.2010)
- Appendix table 3. Households net acquisition of financial assets, million EUR (15.7.2010)
- Appendix table 4. Households net incurrence of liabilities, million EUR (15.7.2010)
- Appendix table 5. Financial assetst of Non-financial corporations, million EUR (15.7.2010)
- Appendix table 6. Financial liabilities of Non-financial corporations, million EUR (15.7.2010)
- Appendix table 7. Net financial assets by sector, million EUR (15.7.2010)
- Appendix table 8. Net financial transactions by sector, million EUR (15.7.2010)
- Appendix table 9. Statistical discrepancy by sector, million EUR (15.7.2010)
- Figures
Updated 15.7.2010
Official Statistics of Finland (OSF):
Financial accounts [e-publication].
ISSN=1458-8145. 2009. Helsinki: Statistics Finland [referred: 19.4.2025].
Access method: http://stat.fi/til/rtp/2009/rtp_2009_2010-07-15_tie_001_en.html

